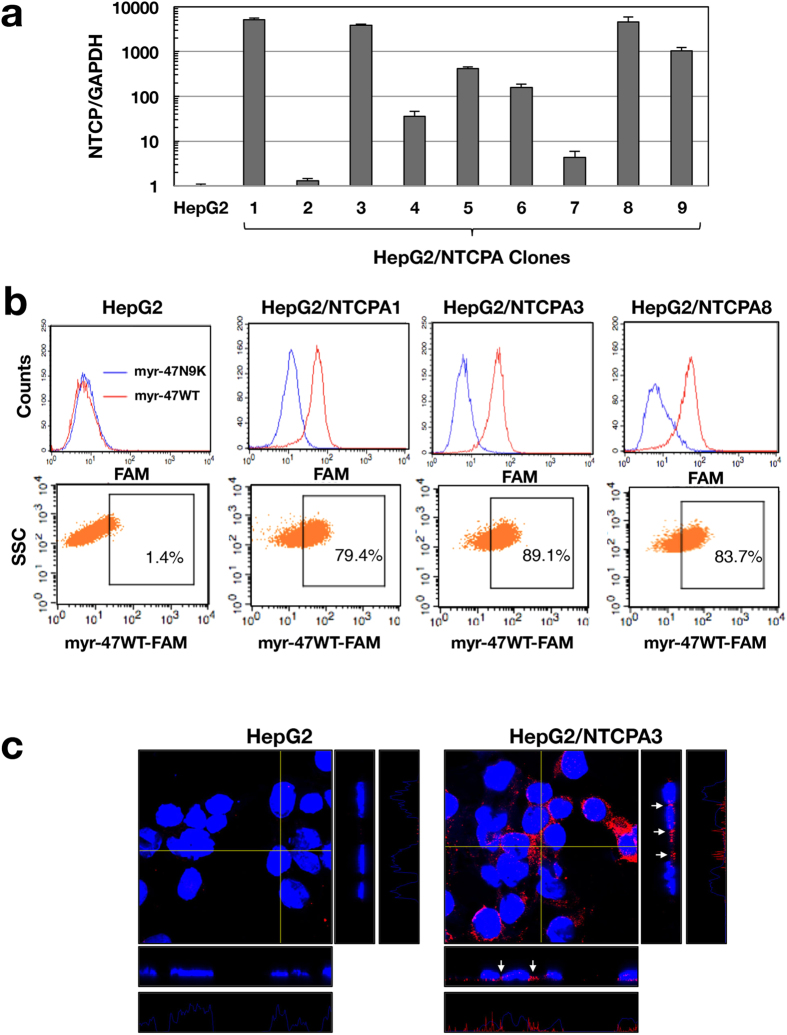
Figure 1. Establishment of a cell line expressing NTCP.
(a) HepG2 cells were transfected with the plasmid encoding NTCP. The cells expressing NTCP were isolated as independent colonies and were then cloned by limited dilution. The amount of NTCP mRNA was evaluated by real-time qRT-PCR. HepG2/NTCPA1, 3, or 8 highly expressed NTCP. (b) Cell surface expression of NTCP was analyzed by FACS analysis using the lipopeptide myr-47WT. The lipopeptide myr-47N9K was used as a negative control. (c) HepG2 and HepG2/NTCPA3 cell lines were immunostained with the antibody to NTCP (red color) and counterstained with DAPI (blue color). These cells were observed under a confocal microscope. Orthogonal views (z-stacks) of each image are shown at the immediate right (yz planes) and lower (xz planes) of each main image. The z-stack step size was 0.5 μm. Arrows indicate the expression of NTCP in cell-cell contact regions. The fluorescent intensity profiles of NTCP in z-stacks are shown at the right end and bottom of each panel group.

