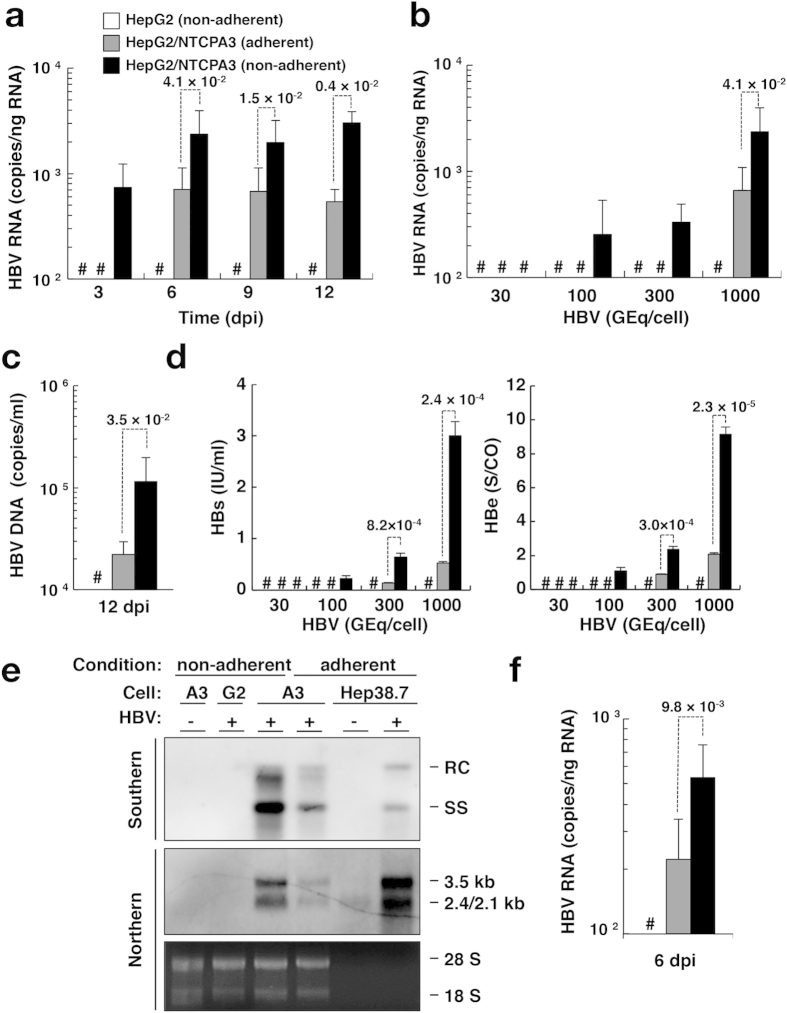
Figure 4. Effect of cell conditions on HBV infectivity.
Non-adherent HepG2 cells (white bars), adherent HepG2/NTCPA3 cells (gray bars), or non-adherent HepG2/NTCPA3 cells (black bars) were infected with HBV. (a) Non-adherent or adherent cells were infected with HBV at 1,000 GEq/cell and harvested at the indicated dpi. The amount of intracellular HBV RNA was quantified by real-time qRT-PCR. (b) Non-adherent or adherent cells were infected with the indicated amount of HBV and harvested at 6 dpi. The amount of intracellular HBV RNA was quantified by real-time qRT-PCR. (c) Non-adherent or adherent cells were infected with HBV at 1,000 GEq/cell. Culture supernatants were collected at 12 dpi. The amount of supernatant HBV DNA was quantified by real-time qPCR. (d) Non-adherent or adherent cells were infected with the indicated amount of HBV. Culture supernatants were collected at 12 dpi. The amount of supernatant HBs (left half) and HBe (right half) antigens were quantified by a chemiluminescence immunoassay. (e) Non-adherent HepG2 cells, non-adherent HepG2/NTCPA3 cells, or adherent HepG2/NTCPA3 cells were infected with HBV at 1,000 GEq/cell (HBV: +). As a negative control, non-adherent HepG2/NTCPA3 cells were mock-infected (HBV: −). Hep38.7-Tet cells maintained with (HBV: −) or without tetracycline (HBV: +) were used as a negative or positive control of molecular size. Encapsidated HBV DNA was subjected to Southern blotting (top panel). Northern blotting of HBV RNAs was carried out by using total RNAs (middle panel). As a loading control for Northern blotting, 28 S and 18 S rRNAs stained with ethidium bromide are shown in a bottom panel. G2 and A3 indicate HepG2 and HepG2/NTCPA3, respectively. RC and SS indicate relaxed-circular and single-stranded, respectively, forms of HBV DNA. (f) Non-adherent or adherent cells were infected with blood-borne HBV at 1,000 GEq/cell. The resulting cells were harvested at 6 dpi. The amount of HBV RNA was quantified by real-time qRT-PCR. Data were calculated from 4 to 8 independent experiments and are expressed as means ± SD. The p-value obtained using Student’s t-test is indicated above the broken line of a bar pair. Number sign (#) indicates “a value was not detected”.

