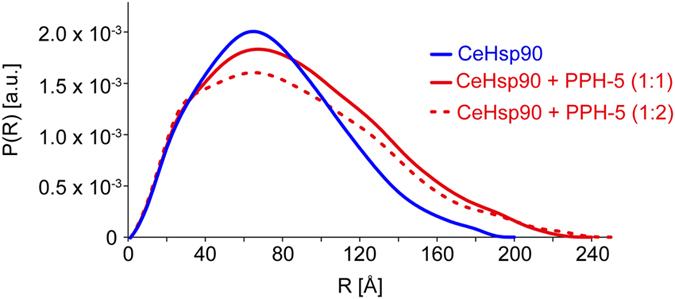
Figure 3. SAXS curves imply a small extension of the protein upon complex formation.

SAXS data showing a comparison of the experimental radial density distributions of CeHsp90 (blue) and with increasing stoichiometric ratios of PPH-5 as indicated (red straight line and red dashed).
