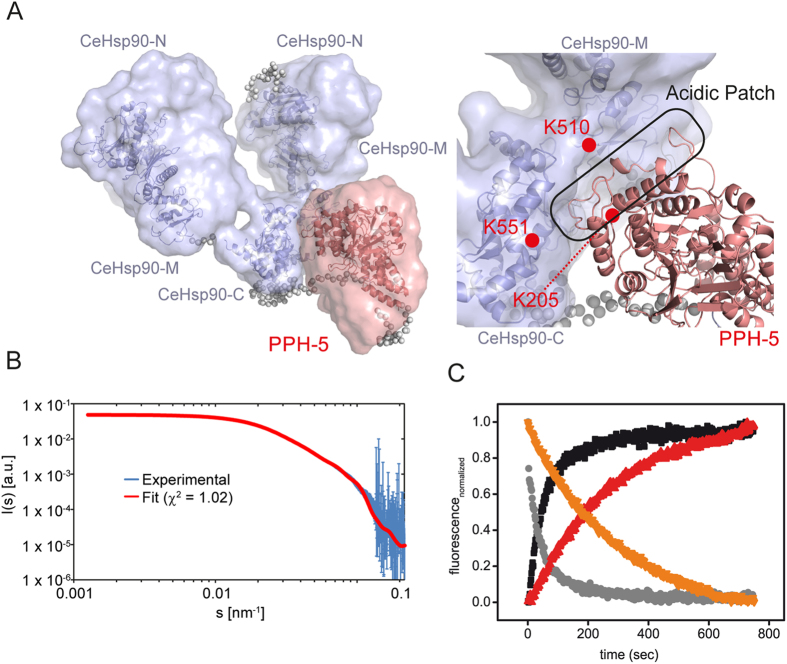
Figure 5. SAXS/MS structure calculations.
(A) Structural model for the CeHsp90-PPH-5 complex. The surface represents the conformational space sampled in the 5 best structures according to the fit between the experimental and back-calculated SAXS data. Structures are aligned to the CeHsp90-C domain. Positions of the cross-linked lysine residues and of the acidic patch in PPH-5 are indicated. (B) Comparison of experimental CeHsp90-PPH-5 SAXS data with SAXS data back-calculated from the CORAL model of the CeHsp90-PPH-5 complex. Both, the s, and I(s) axes are shown in a logarithmic representation. The angular ranges from 0.0014–0.3 nm−1 are compared. (C) Subunit exchange experiment of yHsp90 in the absence and presence of PPH-5. A ten-fold excess of unlabelled yeast Hsp90 was added to an equal mixture of 0.2 μM of N-terminally ATTO488-labeled Hsp90 and 0.2 μM N-terminally ATTO550-labeled Hsp90 in absence and presence of PPH-5 (3 μM). The donor channel signal is depicted in absence of PPH-5 (black) and in presence of the phosphatase (red) as well as the acceptor channel signal (without PPH-5 – grey, with PPH-5 – orange).

