
Figure 1.
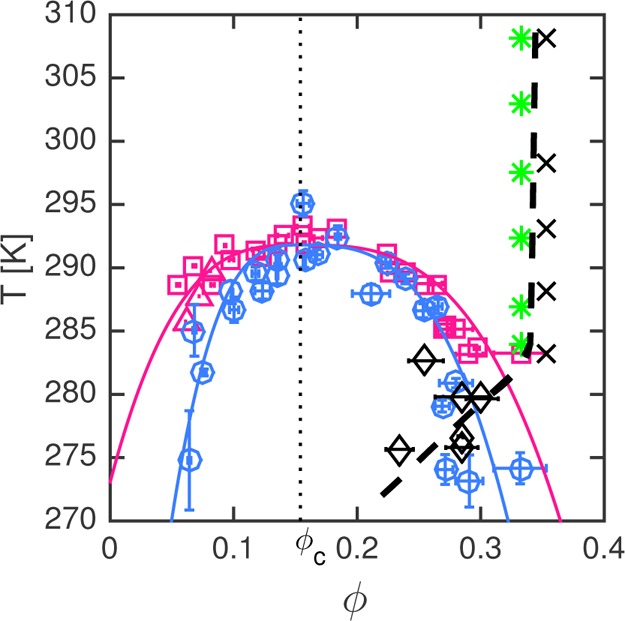
State diagram of γB-crystallin in D2O. Shown are the binodal (fuchsia □, cloud point measurements; fuchsia △, shallow quenches) and the spinodal (blue ○) and the corresponding fits (T = Tc·[1 – A·(|ϕ – ϕc|/ϕc)(1/β)], with β = 0.33; binodal, A = 0.065 and 0.029; spinodal, A = 0.248 and 0.057), as well as the arrest line (dashed line) as a function of ϕ. The location of the latter was determined by a combination of deep quenches (◊) and DLS data (green *, ergodic; ×, nonergodic). ϕc is marked by the dotted line.