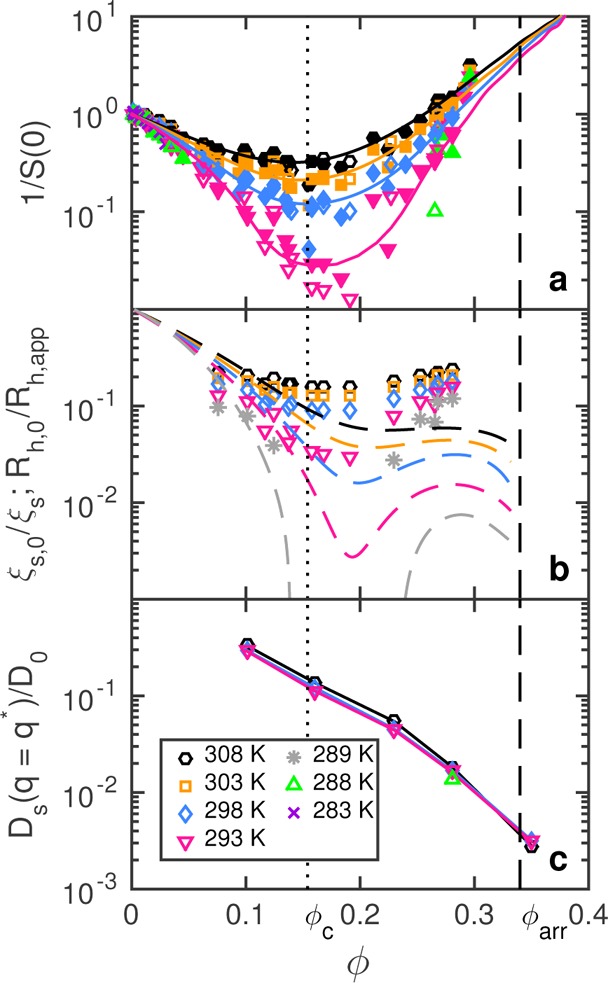
Figure 2.

(a) Inverse S(0) from SLS (filled symbols) and SAXS (open symbols) versus ϕ at different T and the corresponding model fits (full lines). (b) Inverse normalized correlation length versus ϕ as a function of T. Symbols, inverse static correlation length (from SAXS); dashed lines, inverse dynamic correlation length (actual data points shown in Supporting Information Figure S2). (c) Normalized short-time diffusion coefficient from NSE versus ϕ as a function of T. The dotted line marks ϕc, whereas the dashed line indicates the location of the macroscopic arrest line ϕarr (cf. Figure 1).
