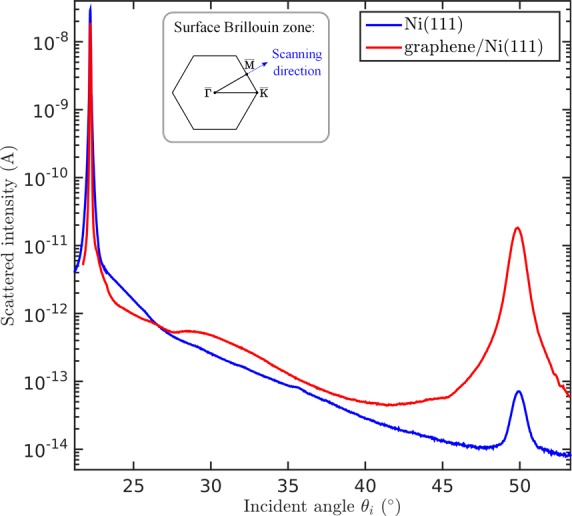
Figure 2.

Comparison of the scattered intensities for graphene/Ni(111) and clean Ni(111) versus incident angle θi. Both scans were taken along the ΓM azimuth with the crystal at room temperature and a beam energy of 8 meV. The intensity of the diffraction peak is increased on the graphene covered surface which indicates a larger corrugation of the surface electron density compared to the pristine Ni surface. The inset shows the surface Brillouin zone and the scanning direction.
