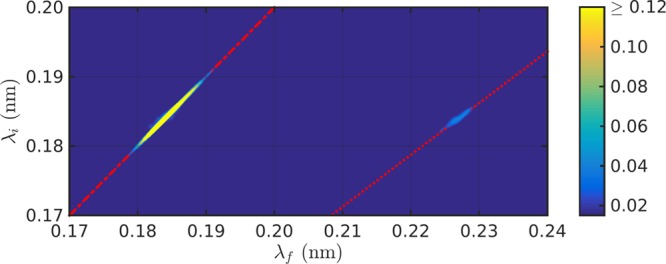
Figure 6.

2D wavelength intensity matrix for graphene/Ni(111) along ΓM recorded at θi = 18.2°, a beam energy of 8 meV, and a sample temperature of 150 K. The plot shows the measured probability for detecting a scattered He atom with wavelength λf versus the incoming wavelength λi (see refs (8 and 38) for details). The only two visible features are the elastic peak (at λf = λi) and the Rayleigh mode on the creation side (at larger λf). This is also highlighted by the red dash-dotted line which corresponds to elastic scattering (λf = λi) and the red dotted line which corresponds to the phonon dispersion of the Rayleigh wave of Ni(111).
