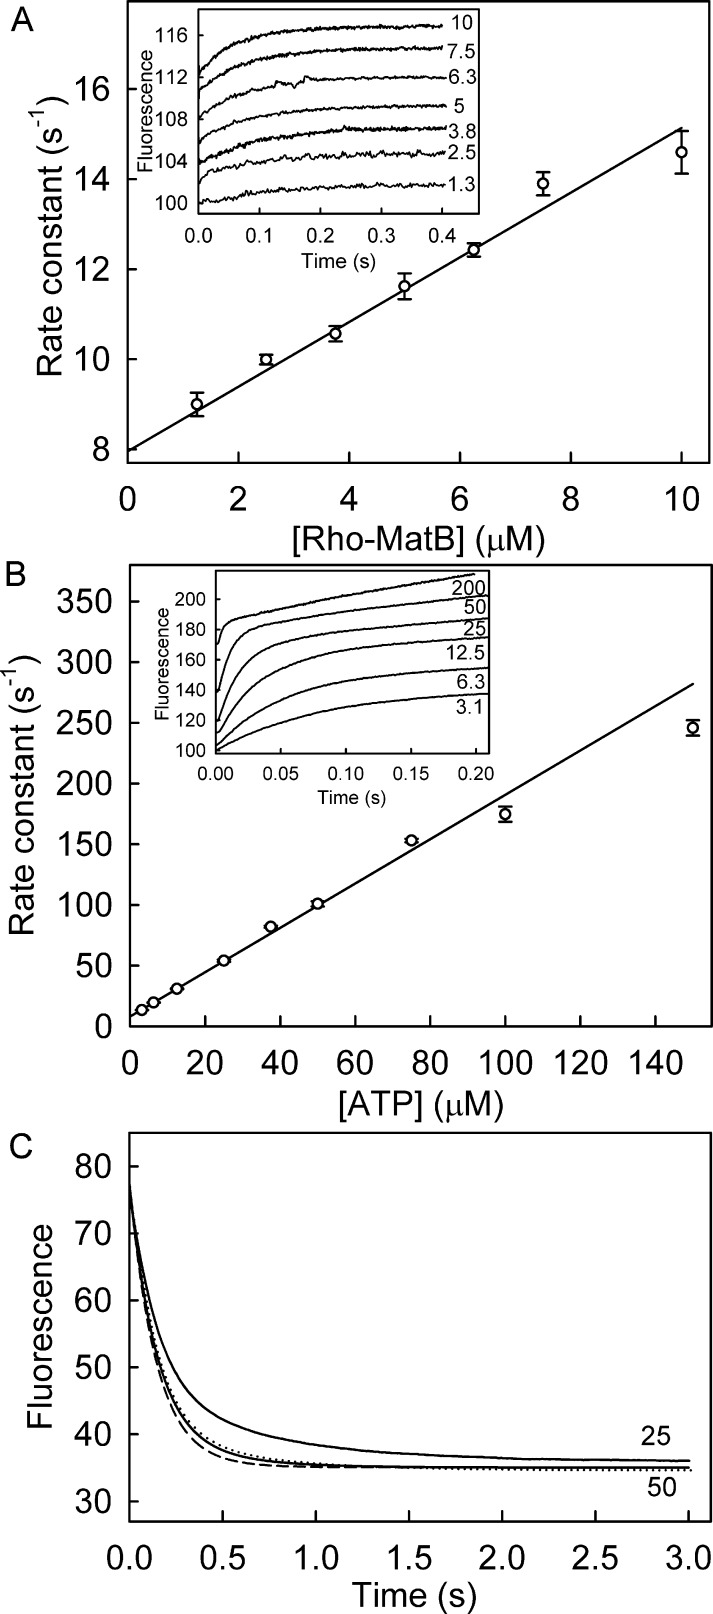
Figure 4.
Association and dissociation kinetics of Rho-MatB and ATP. (A) Association kinetics under pseudo-first-order conditions over a range of Rho-MatB concentrations (shown as micromolar) in 10-fold excess over ATP at 25 °C in solution conditions as in Figure 2 using a stopped-flow apparatus. Fluorescence time courses (inset) were normalized to 100% for the initial intensity but offset by 2% from each other for clarity and were well fit with a single exponential. Data at 1.3 and 2.5 μM are averages of at least three traces. Fits are shown in Figure S1A. The observed rate constants were plotted against Rho-MatB concentration, and linear regression gave an association rate constant of 0.72 ± 0.03 μM–1 s–1 and an intercept of 7.95 ± 0.18 s–1. (B) Association time course under pseudo-first-order conditions by mixing 0.25 μM Rho-MatB with a large excess of ATP at different micromolar concentrations, as shown (inset). The time courses showed biphasic fluorescence changes. The observed rate constants for the fast phase (kobs; Figure S1B) were plotted against ATP concentration. Linear regression gave an association rate constant of 1.83 ± 0.02 μM–1 s–1, and the intercept was 8.15 ± 0.17 s–1. (C) To determine the dissociation time course, ATP (5 μM) and Rho-MatB (0.25 μM) were premixed to give the complex and then rapidly mixed with 25 μM or 50 μM (His6/C106A/K488A)RpMatB under conditions as above in a stopped-flow apparatus. The dissociation was simulated (dashed line) using the conformational selection mechanism (Figure 5A) and rate constants obtained from global fitting (Table S5), while assuming the association rate constant with the unlabeled MatB trap was the same as with Rho-MatB, but its dissociation constant was 20-fold lower to account for the tighter binding. Note that the small deviation from experimental results may be due to the two conformations of Rho-MatB having slightly different fluorescence intensities: the model assumes they have the same. The dotted line is with fluorescence of Rho-MatB1 13% less than that of Rho-MatB2.

