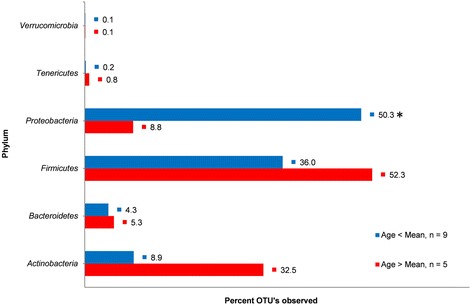
Fig. 5.

Phylum-level abundance percentages relative to age. Abundance measurements based on 16S rRNA gene sequence reads and assigned by alignment with Greengenes ribosomal database using an OTU definition of 97 % sequence homology with a minimum cluster size of 3. Samples representing infants younger than the overall mean infant age of 87.9 days include CDC68129, CDC68058, CDC9068, CDC68083, CDC68116, CDC68192, CDC68053, CDC69114, and CDC68112, and samples representing infants older than the overall mean infant age of 87.9 days include CDC68090, CDC68126, CDC68122, CDC69062, and CDC69078. Ages are based on the age of the infant at the time of sample collection. The asterisk indicates a significant difference in phylum abundance was calculated between the two age groups
