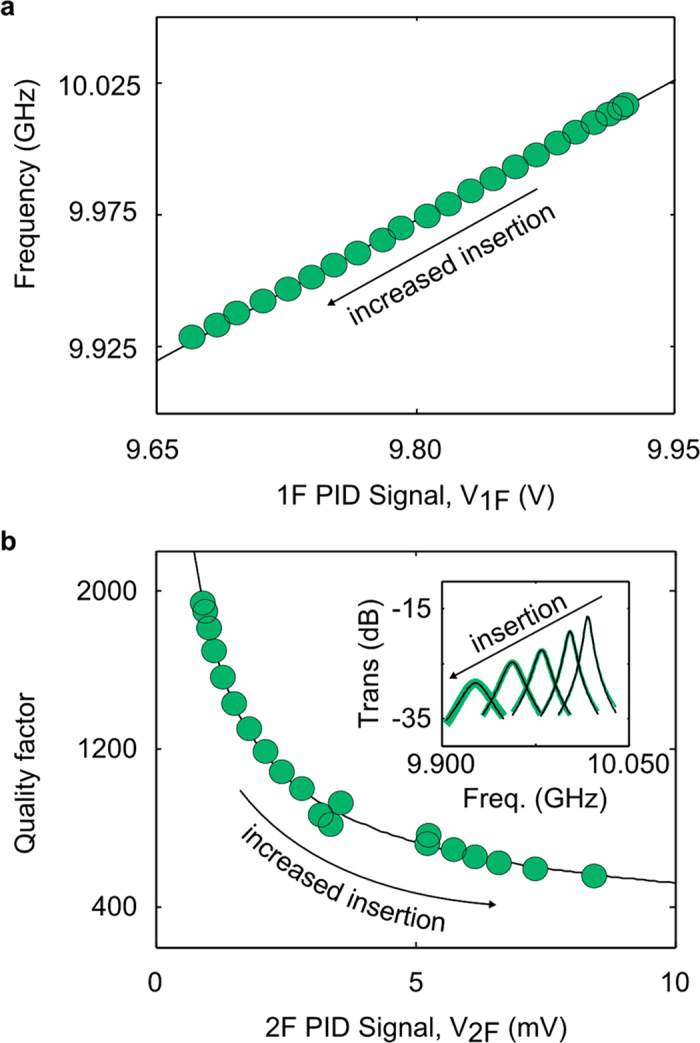
Figure 2. The mapping functions from voltages to frequency and unloaded quality factor.

2 (a) The 1F proportional-integrator-derivative (PID) signal (V1F) versus the resonant frequency. (b) The 2F PID signal (V2F) versus the unloaded quality factor for the same samples in (a). (b) Inset, the magnitude of the transmission of the control sample at variable insertion (green lines) with the harmonic oscillator model (black lines) used to extract the natural frequency and unloaded quality factor. The uncertainties in (a,b) were approximately the size of the data circle.
