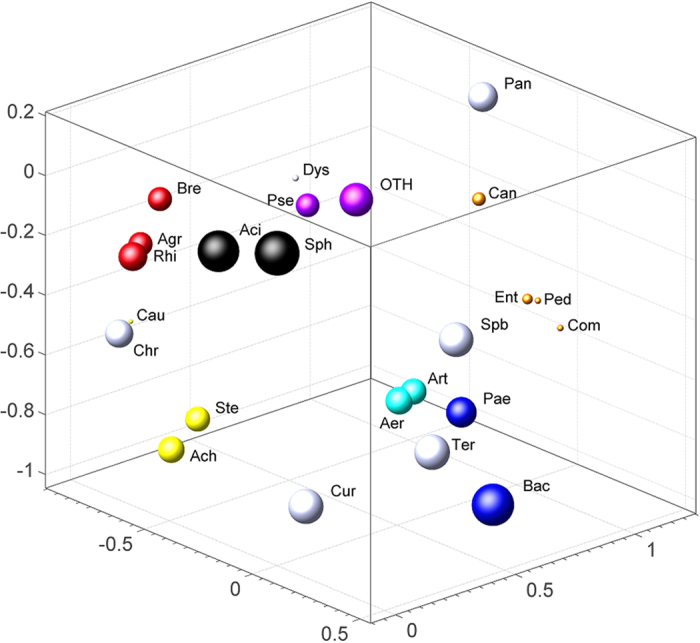
Figure 3. Correlations among the bacterial genera detected in this work.

Distances correspond to the linear statistical correlation. Sizes of the spheres are proportional to the relative abundances in logarithmic scale. Highly correlated genera are shown in the same colour. Sph, Sphingobium; Bac, Bacillus; Aci, Acinetobacter; Ter, Terribacillus; Cur, Curtobacterium; Pae, Paenibacillus; Pan, Pantoea; Rhi, Rhizobium; Chr, Chryseobacterium; Aer, Aerococcus; Art, Arthrobacter; Ste, Stenotrophomonas; Ach, Achromobacter; Pse, Pseudomonas; Can, Candidatus Cloacamonas; Agr, Agrobacterium; Bre, Brevundimonas; Ent, Enterococcus; Cau, Caulobacter; Dys, Dysgonomonas; Spb, Sphingobacterium; Ped, Pedobacter; Com, Comamonas; Oth, Other genera.
