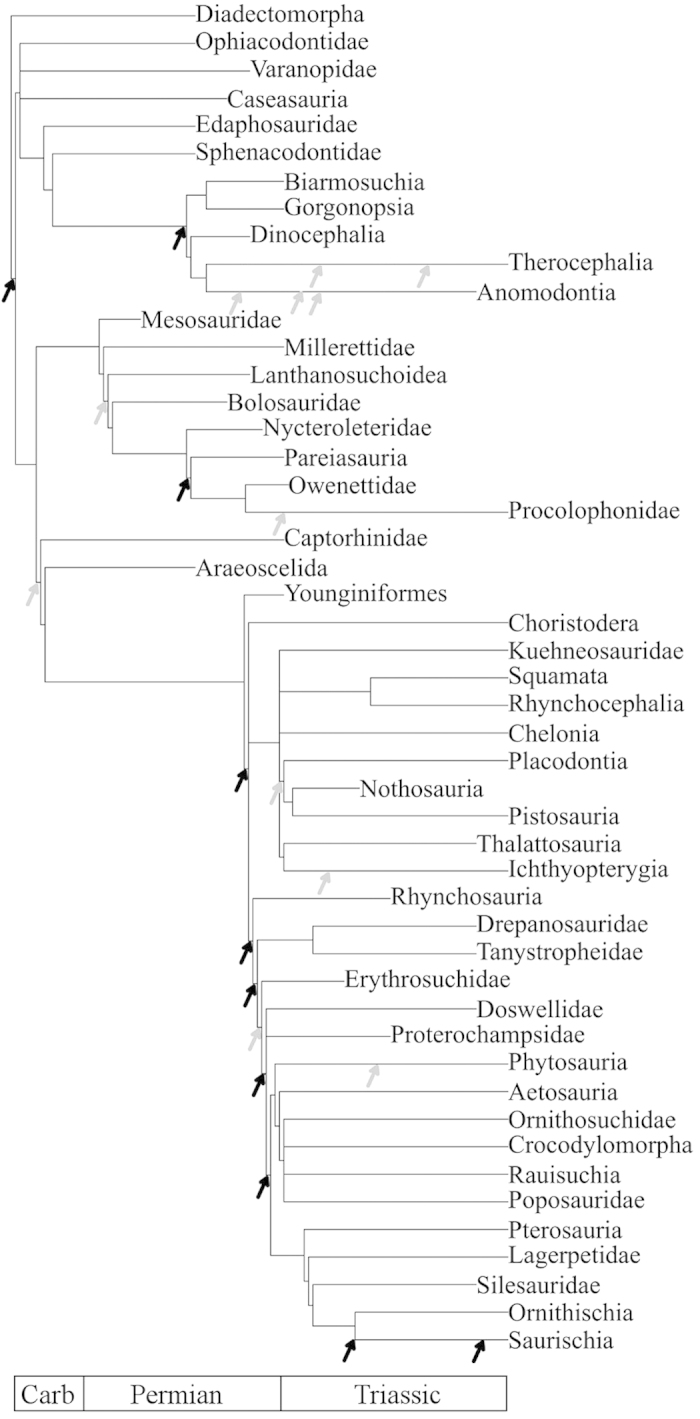
Figure 1. A summary version of the strict consensus supertree (see Supplementary Data 3 for the full tree).

Grey arrows indicate substantial diversification shifts; black arrows significant shifts. Shifts occurring along branches are placed to represent the time of the shift (see Supplementary Data 7 for the precise time and location of the shifts).
