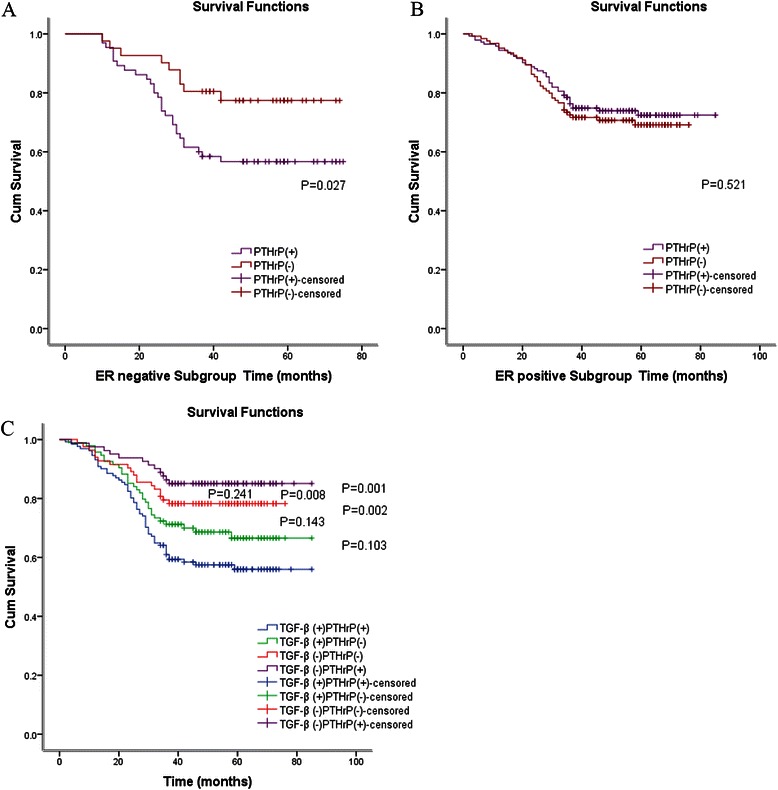
Fig. 3.

a. Kaplan-Meier analyses of the effect PTHrP expression in ER negative subgroup on DFS (P=0.027, log-rank test) b. Kaplan-Meier analyses of the effect PTHrP expression in ER positive subgroup on DFS (P = 0.521, log-rank test) c. Kaplan-Meier analyses of the effect PTHrP and TGF-β expression on DFS
