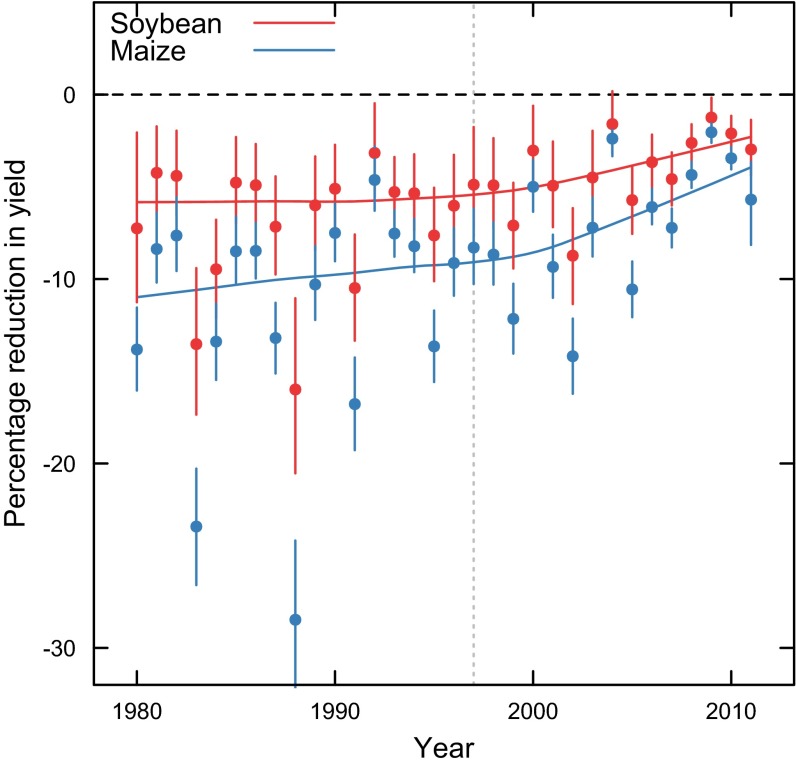
Fig. 1.
Estimated percentage reduction of soybean and maize yield from O3 for 1980–2011. Each point is a weighted mean of percentage reduction for all counties, where the value of a county was weighted by the harvested acreage of soybean or maize in that county. Percentage reduction was estimated by using Eq. 4 to predict yield using historical values of W126 or a value of 0 W126. The lines are a LOESS fit to the points. The black, dashed, horizontal line marks 0 change for reference. The gray, vertical, dotted line indicates when the EPA implemented more stringent standards for O3 emissions. Bars are 95% confidence intervals of yield reduction for that year.

