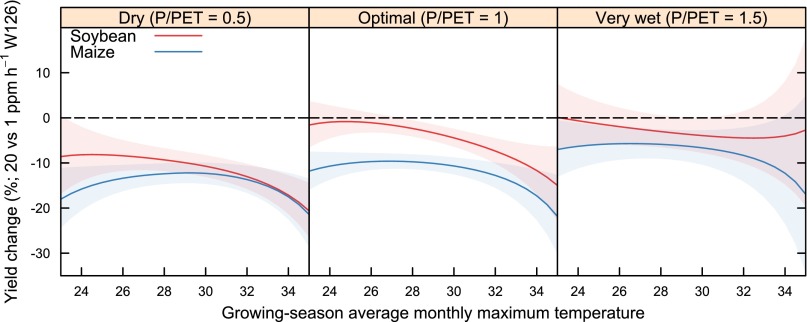
Fig. 2.
Sensitivity of soybean and maize yield to [O3] across a range of values for P/PET and Tmax. Each panel gives estimates of sensitivity at a different P/PET, and values for P/PET are given in the top of each panel. The mean and 95% confidence limits are shown for estimates of percentage reduction of yield in 1 ppm h W126 compared with 20 ppm h W126 from a LOESS model. The black, dashed line indicates no change for reference. Negative values indicate that O3 decreased yield.

