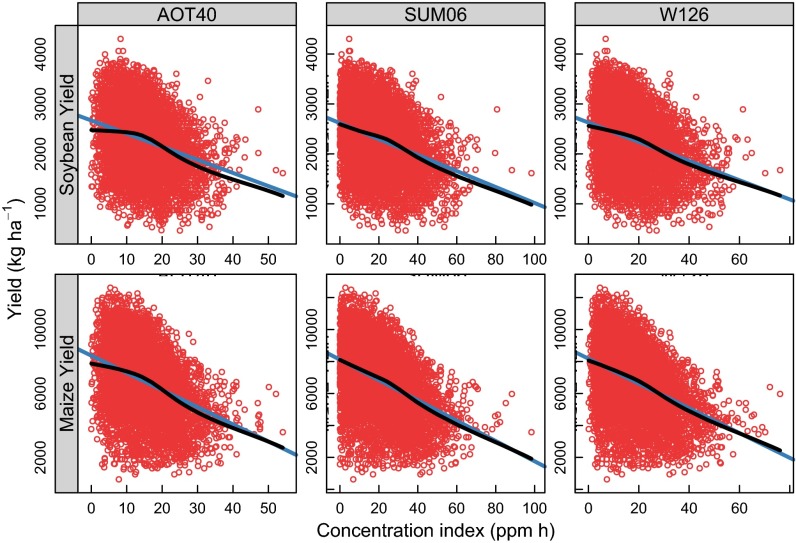
Fig. S1.
Yield vs. three different O3 indices for maize and soybean across all locations and times. Points are observations at each site and time. A LOESS fit is shown in black, and a linear fit is shown in blue. The yield response is similar regardless of the index but is closer to linear for W126. The responses in these panels include only the three indices but do not include any of the other effects in Eq. 1. Thus, they do not give a comprehensive view of yield response to [O3].

