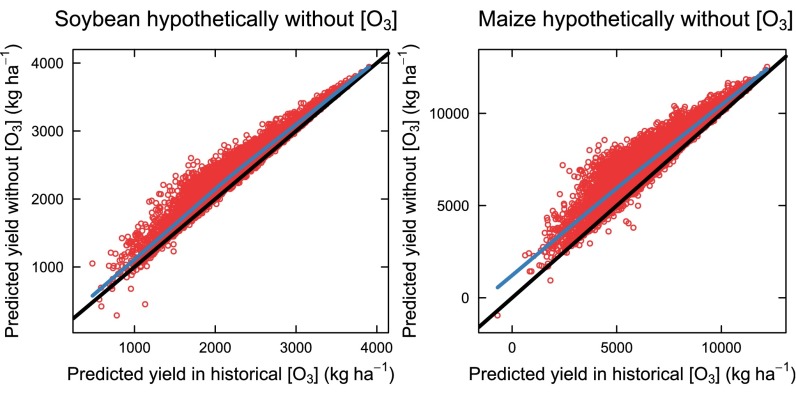
Fig. S3.
Yields of soybean and maize predicted from the model (Eq. 4) using zero W126 and historical climate data against yield predicted from the model using historical W126 and climate. Points are individual predictions for each county–year combination. The black line is the expectation for a 1:1 response, and the blue line is a LOESS fit to the points, showing that with zero W126 predicted yield tends to be higher than those predicted with historical W126.

