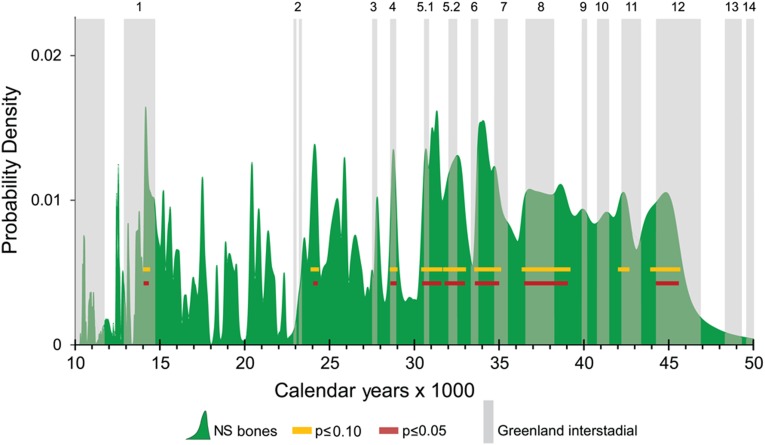
Fig. 4.
The CPD of 263 calibrated ages of North Slope (NS) megafaunal bones (solid green). Yellow bars mark times when there is a P ≤ 0.10 of the peaks in bone abundance being explicable as artifacts of the 14C calibration process. Red bars mark peaks where P ≤ 0.05. Vertical gray bars depict the Greenland Interstadials (GIs) after Rasmussen et al. (47).

