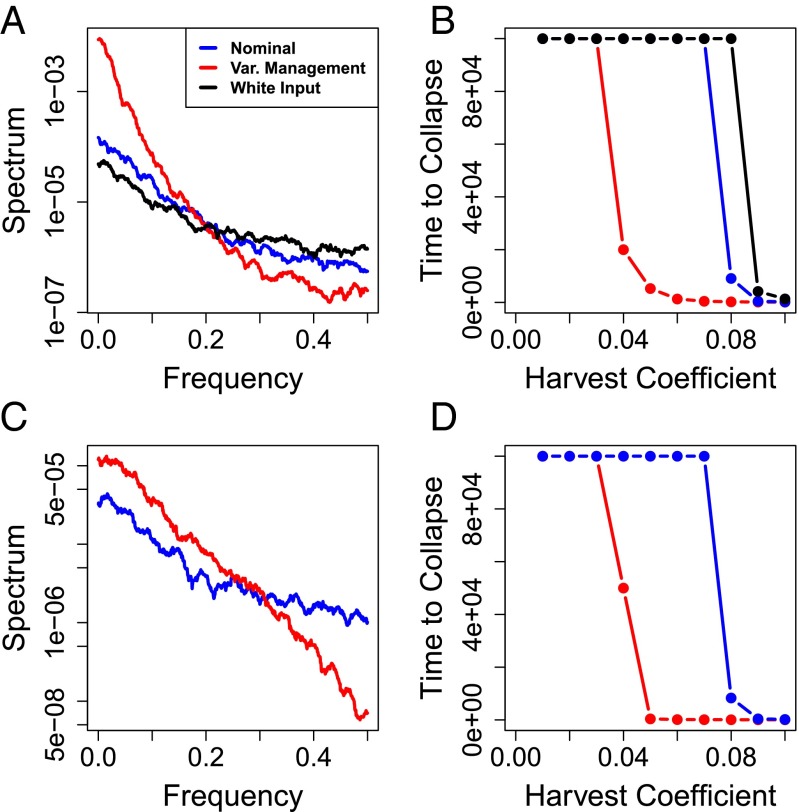
Fig. 3.
Harvest model. (A) Spectra of harvest time series for the noise management case (nominal is no variance management, u = 0; variance management is u = 0.8; white input is u = 0 and uncorrelated shocks). Each point on the spectrum shows variance at the corresponding frequency. Note log scaling. Frequency of 0.5 corresponds to a period of 2 y. (B) Average time steps to collapse of the population vs. harvest coefficient for the three cases shown in A. (C) Spectra for the harvest management case (nominal u = 0; variance management u = −0.6). Each point on the spectrum shows variance at the corresponding frequency. Note log scaling. Frequency of 0.5 corresponds to a period of 2 y. (D) Average time steps to collapse of the population vs. harvest coefficient for the two cases shown in C. In B and D, each data point is based on simulation of 100,000 time steps.

