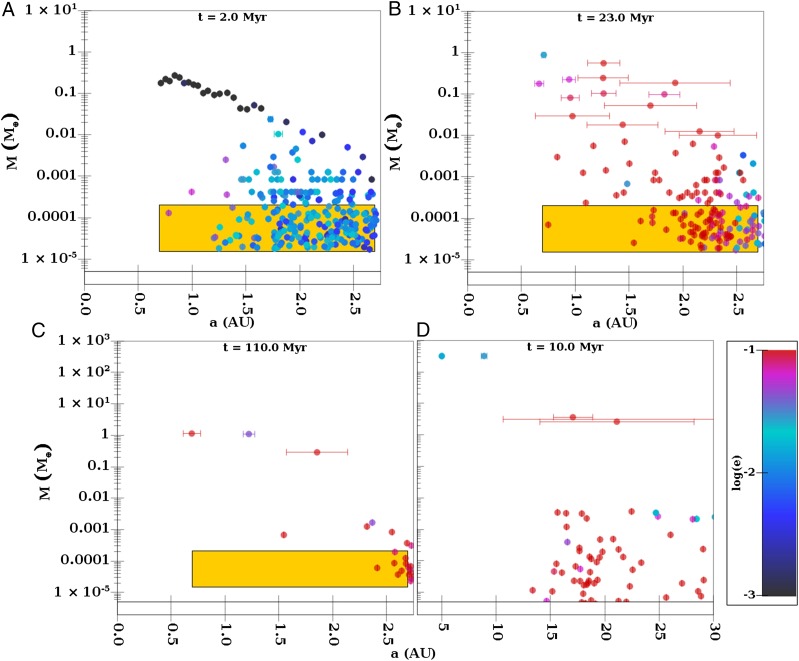
Fig. 2.
(A–C) The formation of a system of terrestrial planets. Each panel shows the mass of the planetesimals and planetary embryos as a function of semimajor axis, and color indicates their eccentricity. In addition, the error bars, which are only shown for objects larger than to decrease clutter, indicate the range of heliocentric distance that an object travels. The yellow box shows the region populated by planetesimals at . (A) t = 2.0 Mya, (B) t = 23.0 Mya, and (C) t = 110.0 Mya. B shows the distribution of planetary embryos after pebble accretion but before the dynamical instability. C shows the final system. (D) The fiducial giant planet system constructed in ref. 6.

