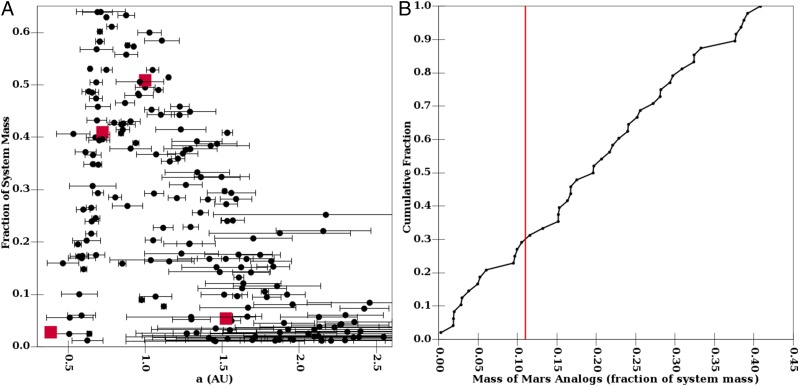
Fig. 3.
The finial distribution of our planets. (A) The black dots show a compilation of the planets constructed during our simulations. In particular, we plot the fraction of total system mass in each planet as a function of its semimajor axis. Here we plot the fraction of total system mass because the total mass of our systems varies from run to run due to the stochastic variations in the efficiency of pebble accretion. The error bars indicate the range of heliocentric distance that a planet travels and thus are a function of eccentricity. The red squares indicate the real terrestrial planets in the solar system. (B) The cumulative mass distribution of Mars analogs. Planets to the left of the red line are considered good Mars analogs according to ref. 34.

