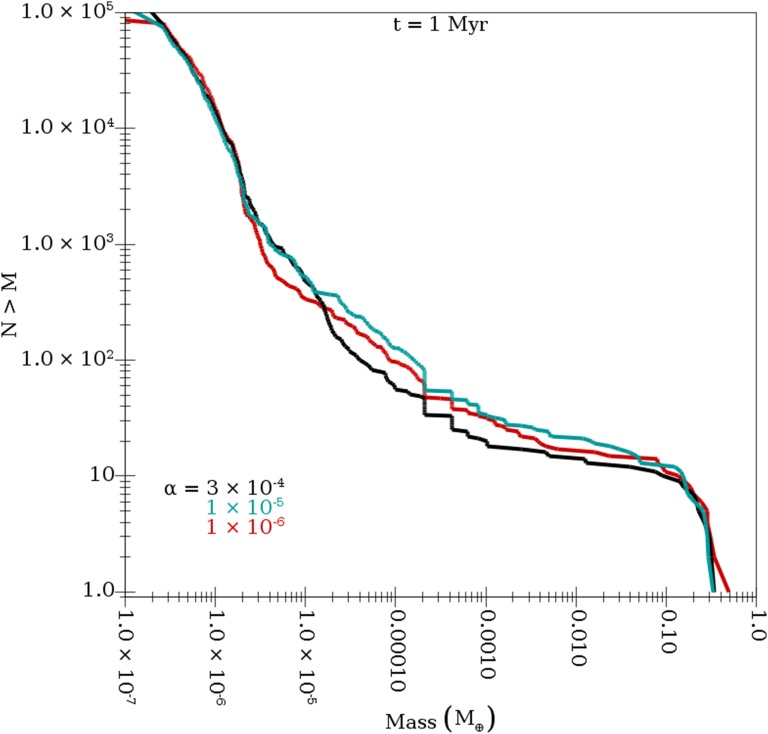
Fig. S1.
The cumulative mass distribution of objects at the end of pebble accretion (i.e., at 1 Mya) in three simulations that are identical except for α. These runs have , – km, and (our smallest value). Three values of α were studied; (our fiducial value; black curve), (cyan curve), and (red curve). Note that all three curves are basically identical.

