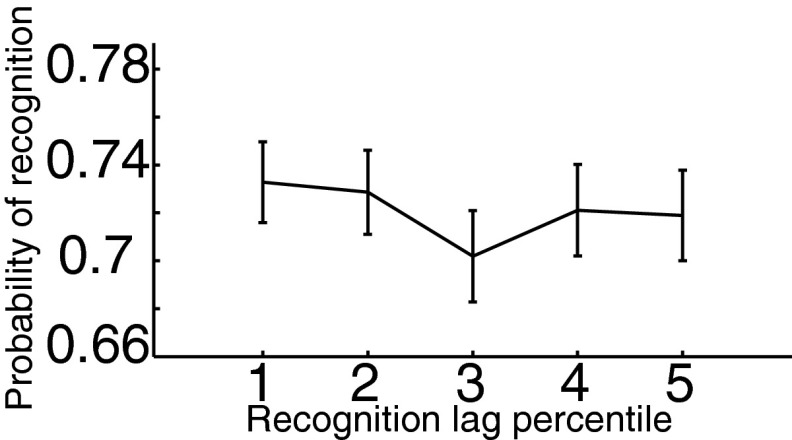
Fig. S2.
Recency behavioral analysis. The number of cognitive events (word encodings, arithmetic distractors, word recalls, test items) between study and test (study–test lag) was calculated for each test item and binned into quintiles. Mean and ±1 SEM for hit rate as a function of study–test lag quintile are displayed; we did not find performance varied as a function of lag category [, mean squared error (MSE) , ].

