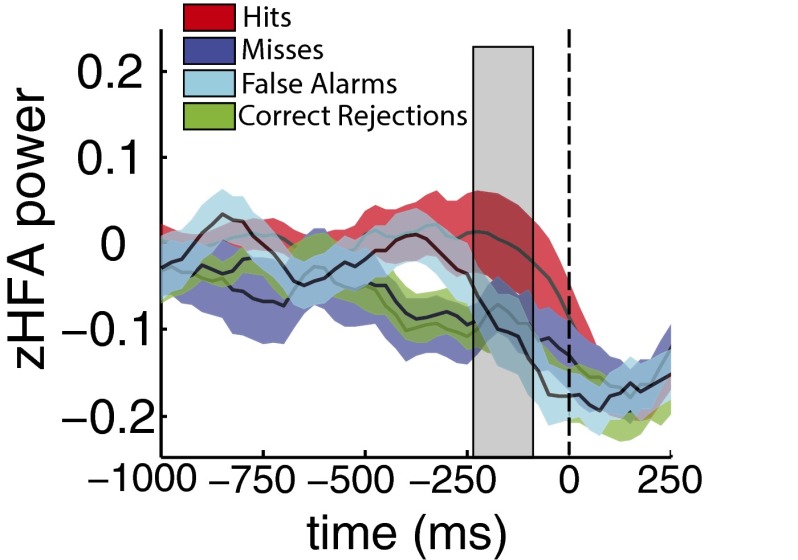
Fig. S3.
Response choice-locked HFA power over time. Across-subject mean and ±1 SEM zHFA power for each of the four stimulus–response choice combinations (color schema same as in Fig. 1) over time (200 ms, 25-ms sliding window) between 1,000 ms prior and 250 ms after test item display (vertical hatched line). A cluster analysis revealed that zHFA significantly varies among the four conditions between 225 and 50 ms prior (shaded in gray) to test item display (permutation procedure, ).

