Fig. 1.
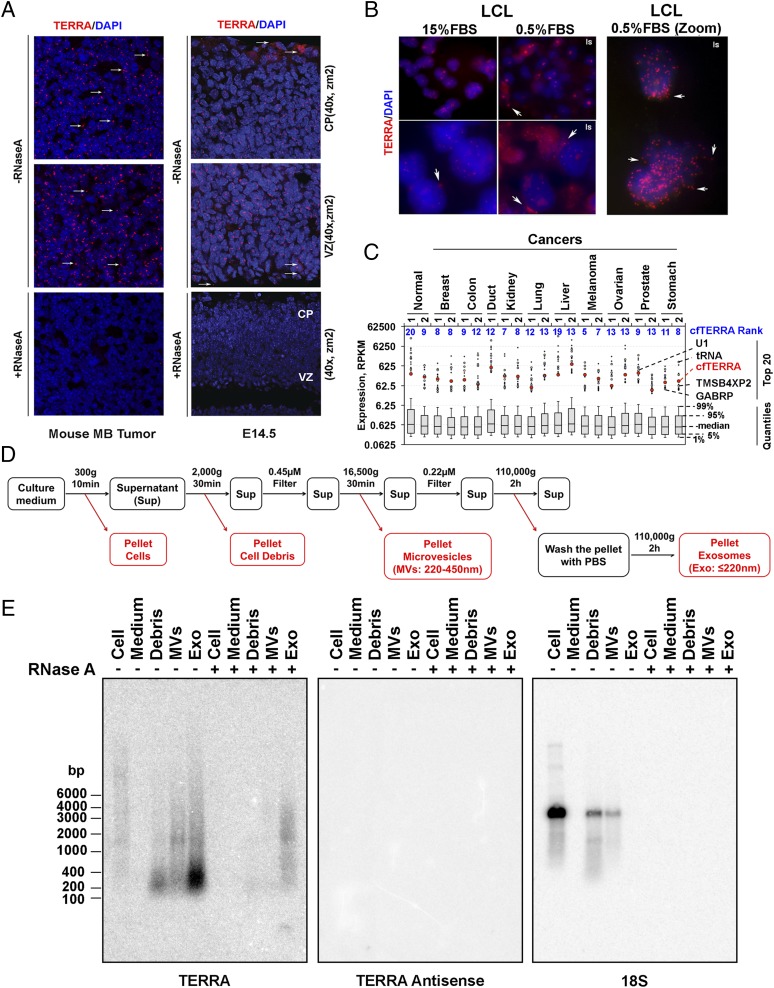
Identification of cfTERRA in exosome fractions. (A) RNA-FISH analysis of TERRA expression on mouse medulloblastoma tumor (Left) and embryonic E14.5 brain tissue sections by confocal microscopy. TERRA was stained with (CCCTAA)3 PNA probe in red, and nuclei were counterstained with DAPI in blue on mouse medulloblastoma tissue (Left) or cerebral cortex section of E14.5 WT mouse embryo (Right). Cortical plate (CP) and ventricular Zone (VZ) are indicated. RNase A treatment eliminates all signals of TERRA (Lower). Arrows indicate TERRA signals found outside of nuclei. Images were taken with 40× lens at zoom 2. (B) TERRA foci were found outside of nuclei in human lymphoblastoid cell lines grown under normal serum (15%) or serum starved (0.5%) conditions for 24 h before fixation. (Right) Zoom image of the same LCL samples. (C) RNA-seq analysis of cell-free DNA from various normal and cancer blood plasma samples. TERRA (as defined by six tandem UUAGGG repeats) and its ranks in read counts relative to all other genes. Whisker plots demonstrate distribution of gene expression levels that had at least 10 aligned RNA-seq reads. Dots represent RPKM values for the top 20 expressed genes. Among those, highlighted are cfTERRA and 6 other known genes that appear in the top 20 genes across all samples the most. (D) Flowchart for fractionation of culture medium by differential centrifugation. The conditions of each centrifugation or filtering are indicated above the black arrows. Pellets highlighted in red are used for analysis of RNA or proteins. (E) Northern blot analysis of TERRA levels in extracellular fractions from LCL culture medium. RNA was isolated from pellets of the differential centrifugation as shown in C. Equal mass amounts of RNA (1 µg) were either mock treated (−) or treated with RNase A (100 µg/mL) for 30 min at 37 °C before Northern blot analysis. The blot is hybridized with 32P-labeled probes for TERRA, antisense TERRA, or 18S RNA, or indicated under the blot. Numbers on the left show the position of RNA markers in base pairs.

