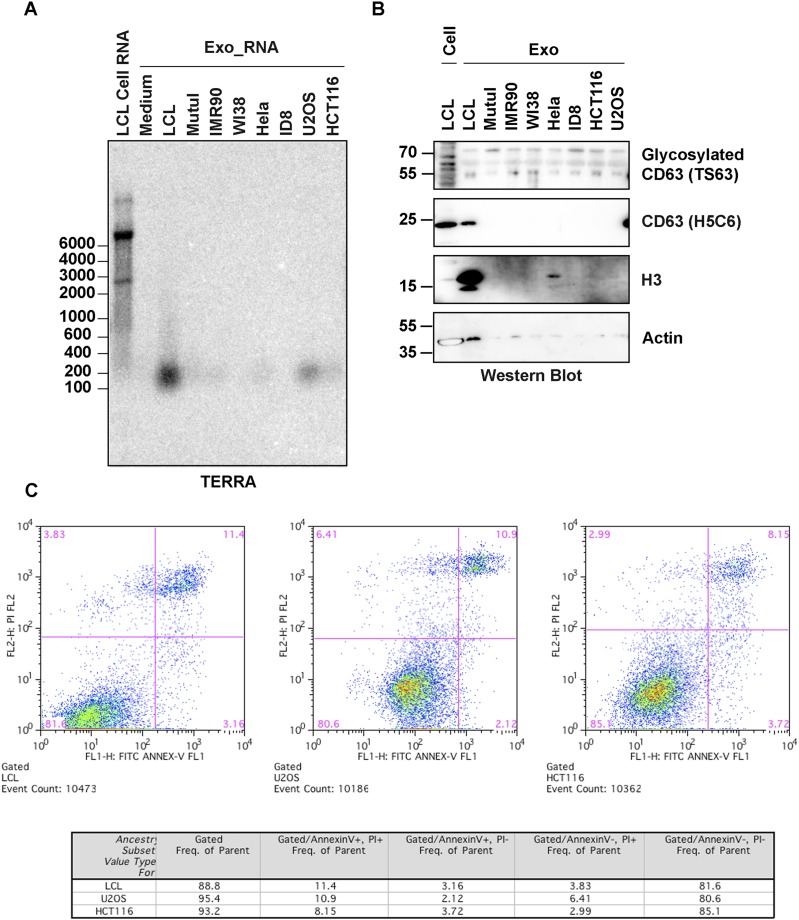
Fig. S2.
cfTERRA was released with different levels in other cell lines. (A) Comparison of cfTERRA levels across several cell lines in exosomes. Exosomes were isolated from indicated cell lines by ultracentrifugation. RNAs were purified from exosomes with equal amount of proteins and analyzed for cfTERRA by Northern blotting. (B) Western blot analysis of exosomes as shown in A. Equal amount of exosomal proteins were analyzed by Western blotting with CD63, H3, or Actin antibodies. (C) Apoptosis analysis of cell lines used for exosome isolation. After 48-h culture of the indicated cell lines in conditional medium, cells were stained with FITC-Annexin V and PI and analyzed by flow cytometry. Flow cytometry profile present as FITC-Annexin V staining in the x axis and PI in the y axis. The number in the upper right quadrant represents the percentage of late apoptotic cells in each cell line.

