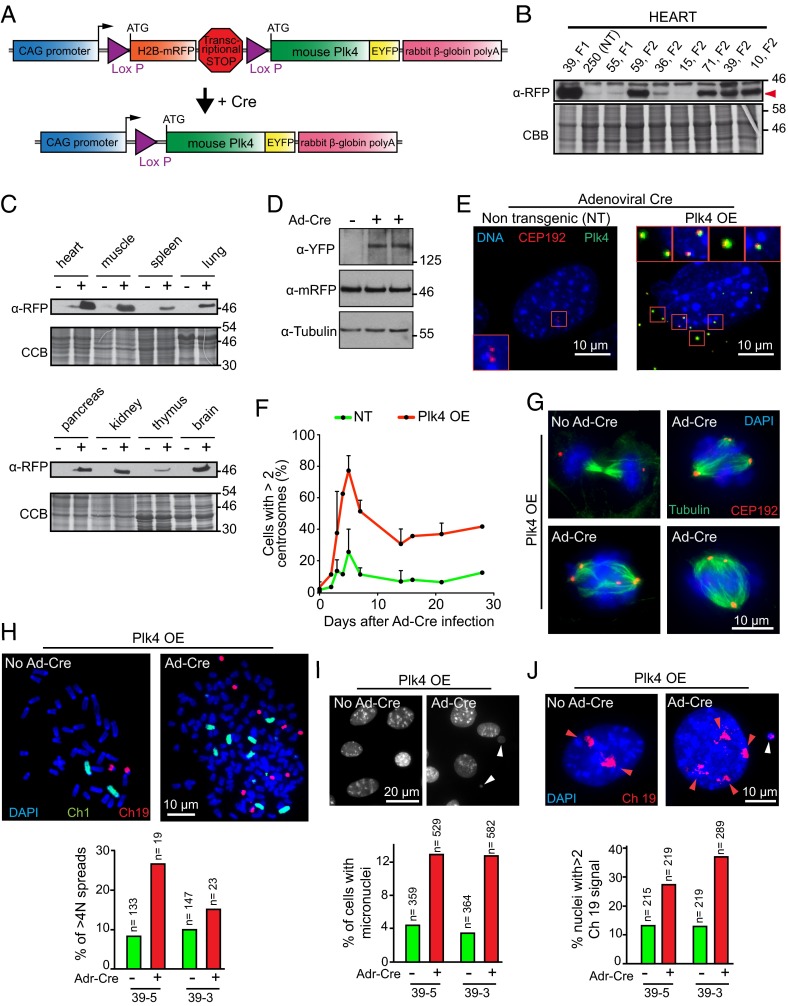
Fig. 1.
Generation of a mouse model for Cre-inducible Plk4 expression. (A) Schematic of the gene construct used to generate inducible Plk4 OE transgenic mice. A chicken β-actin (CAG) promoter initially directs production of H2B-mRFP. Action of Cre at the two Lox P sites will excise the H2B-mRFP gene and the transcriptional stop cassette, thereby activating Plk4-EYFP expression. (B) Immunoblot of H2B-mRFP in heart tissue lysates from various Plk4 OE mouse founder lines. Numbers indicate the founder line. NT, nontransgenic. The red arrowhead indicates the mRFP signal. (C) Immunoblots to determine the expression of H2B-mRFP in various tissues from the transgenic mouse line 39. (−), control (nontransgenic) mice; (+), Plk4 OE mice. (D) Immunoblot of lysates from MEFs showing the accumulation of the Plk4-EYFP protein. (E) Immunofluorescence images of MEFs at 2 d after transduction with Ad-Cre. Plk4-EYFP (green) is visualized only after Cre expression. Accumulation of supernumerary centrosomes was tracked using CEP192 (red). (Scale bar: 10 μm.) (F) Quantification of centrosome amplification (>2 centrosomes per cell) in MEFs at various times after transduction with Ad-Cre. Points represent the mean of two independent experiments. Error bars indicate SD. (G) Immunofluorescence images showing mitotic figures in Plk4 OE MEFs at 5 d after Ad-Cre transduction or without treatment. (Scale bar: 10 μm.) (H) Representative immunofluorescence image of a chromosome spread of an MEF derived from a Plk4 OE mouse at 5 d after treatment with Ad-Cre. Chromosomes 1 and 19 are shown in green and red, respectively. Forty chromosomes are visible in the “no Ad-Cre” condition, and 167 chromosomes are visible in the “Ad-Cre” condition. The graph represents the proportion of cell spreads with >4N DNA content. The quantification was made in two independent populations of MEFs (39-3, 39-5). (I) Representative immunofluorescence image of MEFs derived from a Plk4 OE animal at 5 d after treatment with Ad-Cre. White arrowheads indicate micronuclei. The graph represents the proportion of cells with micronuclei. The quantification was made in two independent populations of MEFs (39-3, 39-5). (J) Representative immunofluorescence image of MEFs, derived from a Plk4 OE animal, at 5 d after treatment with Ad-Cre. The cells were treated with a chromosome painting probe to visualize chromosome 19 (red). Red arrowheads point to chromosome 19 signals. The white arrowhead indicates a chromosome 19 signal in a micronucleus. The graph represents the proportion of cells presenting more than two signals for chromosome 19. The quantification was made in two independent populations of MEFs (39-3, 39-5).

