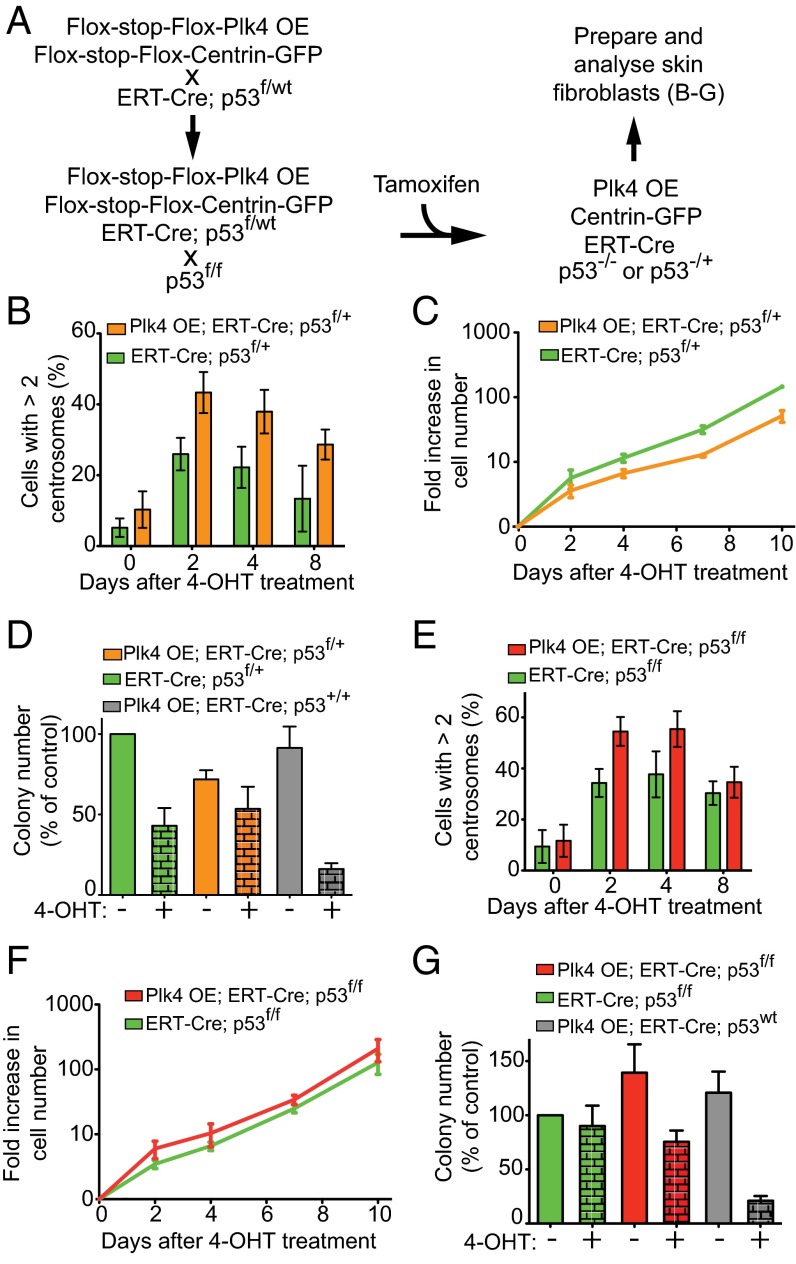
Fig. 4.
p53 reduction or inactivation allows Plk4-induced centrosome amplification in cell culture. (A) Breeding scheme to obtain mice with a Cre-inducible Plk4 transgene, tamoxifen-inducible Cre (ERT-Cre), a Cre-inducible Centrin-GFP allele, and one or two Cre-inactivable p53 alleles. (B) Quantification of centrosome amplification within the Centrin-GFP–positive cell population after 4-OHT treatment. Measurements were done at various times after 4-OHT treatment in Plk4 OE; ERT-Cre;Centrin-GFP;p53f/+ skin fibroblasts and ERT-Cre;Centrin-GFP;p53f/+ control fibroblasts. Bars represent the mean of a minimum of three independent experiments (except for day 8 without the Plk4 OE where two independent experiments were quantified). Error bars indicate SEM. A minimum of 47 cells were analyzed for each data point. (C) Quantification of the change in cell number over time after 4-OHT treatment of Plk4 OE; ERT-Cre;Centrin-GFP;p53f/+ skin fibroblasts and ERT-Cre;Centrin-GFP;p53f/+ control fibroblasts. Lines represent the mean of two experiments. Error bars indicate SEM. (D) Clonogenic survival of Plk4 OE;ERT-Cre;Centrin-GFP;p53f/+ skin fibroblasts and ERT-Cre;Centrin-GFP;p53f/+ control fibroblasts treated with 4-OHT. Bars represent the mean of a minimum of three independent experiments. Error bars indicate SEM. Two plates were analyzed for each data point. (E) Quantification of centrosome amplification within the Centrin-GFP–positive cell population after 4-OHT treatment. Measurements were made at various times after tamoxifen treatment in Plk4 OE; ERT-Cre;Centrin-GFP;p53f/f skin fibroblasts and ERT-Cre;Centrin-GFP;p53f/f control fibroblasts. Bars represent the mean of at least three independent experiments. Error bars indicate SEM. A minimum of 48 cells were analyzed for each data point. (F) Quantification of change in cell numbers over time after 4-OHT treatment of Plk4 OE;ERT-Cre;Centrin-GFP;p53f/f skin fibroblasts and ERT-Cre;Centrin-GFP;p53f/f control fibroblasts. Lines represent the mean of two independent experiments. Error bars indicate SEM. (G) Clonogenic capabilities of Plk4 OE; ERT-Cre;Centrin-GFP;p53f/f skin fibroblasts and ERT-Cre;Centrin-GFP;p53f/f control fibroblasts treated with 4-OHT. Bars represent the mean of a minimum of three independent experiments. Error bars indicate SEM. Two plates were analyzed for each data point.

