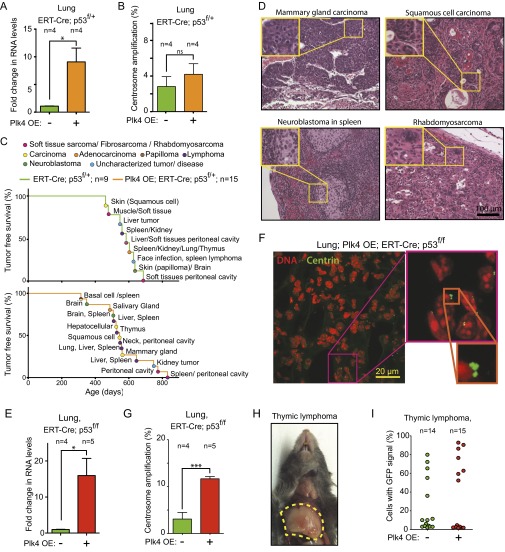
Fig. S3.
Plk4 overexpression does not affect the type of tumor arising from heterozygous loss of p53. (A) Fold change in Plk4 mRNA in the lungs of Plk4 OE; ERT-Cre;Centrin-GFP;p53f/+ mice compared with control ERT-Cre;Centrin-GFP;p53f/+ mice. Measurements were taken at 2 mo after tamoxifen treatment. Bars represent the mean, and error bars indicate SEM. n = 4 mice with Plk4 OE and n = 4 mice without Plk4 OE. *P < 0.05; P value of unpaired t test calculated on the mean values from four independent measurements. (B) Percentage of centrosome amplification within cells expressing Centrin 1-GFP in the lung of Plk4 OE;ERT-Cre;Centrin-GFP;p53f/+ mice and control ERT-Cre;Centrin-GFP;p53f/+ mice. Measurements were taken at 2 mo after tamoxifen treatment. Bars represent the mean, and error bars indicate SEM. n = 6 mice with Plk4 OE and n = 4 mice without Plk4 OE. A minimum of 116 centrin-positive cells were counted for each data point. ns, P value > 0.05; P value of unpaired t test calculated on the mean values from four independent measurements. (C) Tumor-free survival and tumor spectrum of Plk4 OE;ERT-Cre;Centrin-GFP;p53f/+ mice and control ERT-Cre;Centrin-GFP;p53f/+ mice after 2 mo of feeding with food containing tamoxifen. At each event, the location and tumor type are described using a color code. (D) H&E-stained sections of tumors developed in Plk4 OE;ERT-Cre;Centrin-GFP;p53f/+ mice (mammary gland carcinoma, squamous cell carcinoma, and neuroblastoma within spleen) and in ERT-Cre;Centrin1-GFP;p53f/+ control mice (rhabdomyosarcoma). (E) Fold change in Plk4 mRNA in the lungs of Plk4 OE;ERT-Cre;Centrin-GFP;p53f/f mice compared with control ERT-Cre;Centrin-GFP;p53f/f mice. Measurements were taken at 2 mo after tamoxifen treatment. Bars represent the mean, and error bars indicate SEM. n = 5 mice with Plk4 OE and n = 4 mice without Plk4 OE. *P < 0.05; P value of unpaired t test calculated on the mean values from four and five independent measurements. (F) Representative immunofluorescence image of a lung section from a Plk4 OE;ERT-Cre;Centrin-GFP;p53f/f mouse after tamoxifen treatment. (G) Percentage of centrosome amplification within cells expressing Centrin 1-GFP in lungs of Plk4 OE;ERT-Cre;Centrin1-GFP;p53f/f mice and in control ERT-Cre;Centrin1-GFP;p53f/f mice. Measurements were taken at 2 mo after tamoxifen treatment. Bars represent the mean, and error bars indicate SEM. n = 5 mice with Plk4 OE and n = 4 mice without Plk4 OE. ***P < 0.001; P value of unpaired t test calculated on the mean values from four and five independent measurements. A minimum of 101 centrin-positive cells were counted for each animal. (H) Image of a thymic lymphoma developed in a Plk4 OE;ERT-Cre;Centrin-GFP;p53f/f mouse fed with tamoxifen. The dotted line highlights the tumor. (I) Percentage of Centrin 1-GFP–positive cells in individual thymic lymphomas. Tumors were from 15 ERT-Cre;Centrin-GFP;p53f/f animals and 14 Plk4 OE;ERT-Cre;Centrin1-GFP;p53f/f animals. A minimum of 40 centrin-positive cells were analyzed for each tumor.

