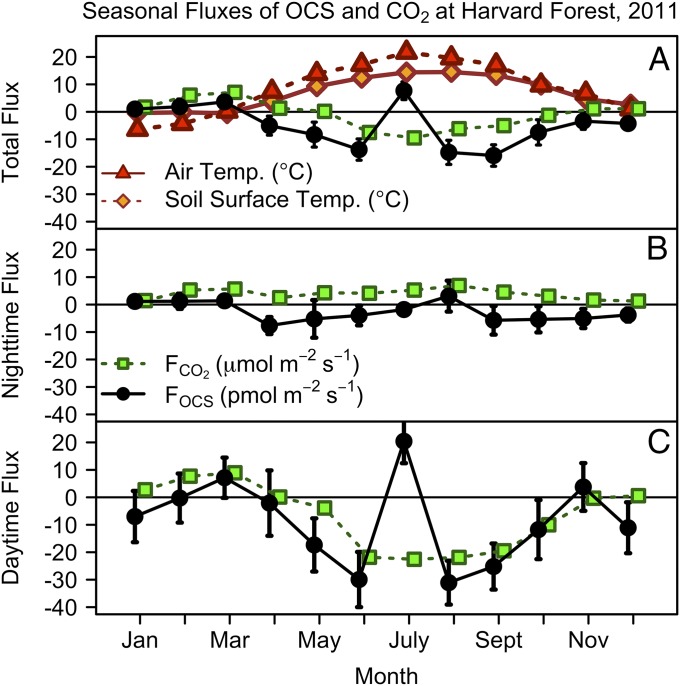
Fig. 1.
Monthly mean OCS (FOCS, pmol⋅m−2⋅s−1; black) and CO2 (FCO2, µmol⋅m−2⋅s−1; green squares) fluxes for 2011. u* > 0.17 m⋅s−1 for all data. (A) Total OCS and CO2 flux by month. Air temperature (red triangles; °C) and surface soil temperature (orange diamonds; °C); CO2 net flux includes changes in storage, but this is not required for OCS. (B) Nighttime OCS (black) and CO2 (green) flux (PAR < 40 µE⋅m−2⋅s−1). (C) Daytime OCS and CO2 fluxes with PAR > 600 µE⋅m−2⋅s−1. Error bars indicate the 95% confidence intervals for all data within the month.

