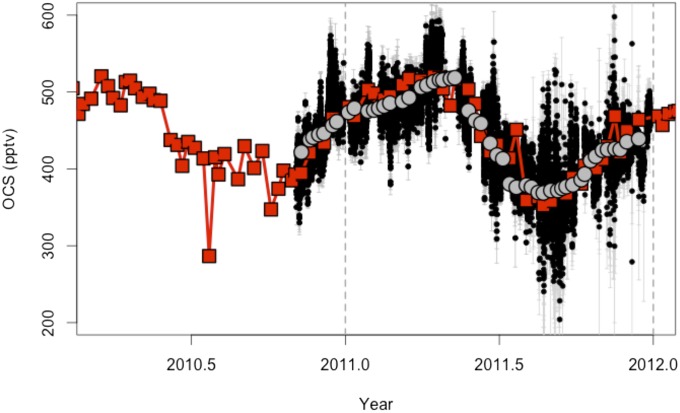
Fig. S1.
Comparison of OCS (pptv; pmol⋅mol−1) measured by the TILDAS [30-min average (black) with 1σ SDs shown in gray], NOAA flask pair means [red points; 1σ SDs shown as red line error bars (barely visible)], and cosampled TILDAS OCS [3-h average at the time of the flask sample (gray circles)]. The flasks were sampled weekly followed by analysis by GC-MS in Boulder as part of the NOAA flask sample network (1).

