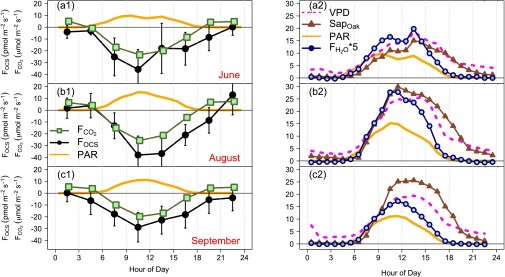
Fig. S7.
Diurnal composite of OCS (black) and CO2 (green) fluxes (Eastern Standard Time) for the summer months of 2011: (A1) June, (B1) August, and (C1) September, with times of low turbulence (u* < 0.17 m⋅s−1) removed. The 95% confidence intervals for each species are shown as black error bars. The 95% confidence intervals for CO2 are barely visible. Both columns show PAR (solid orange line; 10−8 E⋅m−2⋅s−1) on two different scales. A2, B2, and C2 show the sap flow rates for oak (brown triangles; gH2O⋅m−2⋅s−1), the vapor pressure deficit (magenta dashed line; Pa), and the water vapor flux [blue/navy circles; 5 mmol⋅m−2⋅s−1 (multiplied by 5 for graphing)] for June, August, and September.

