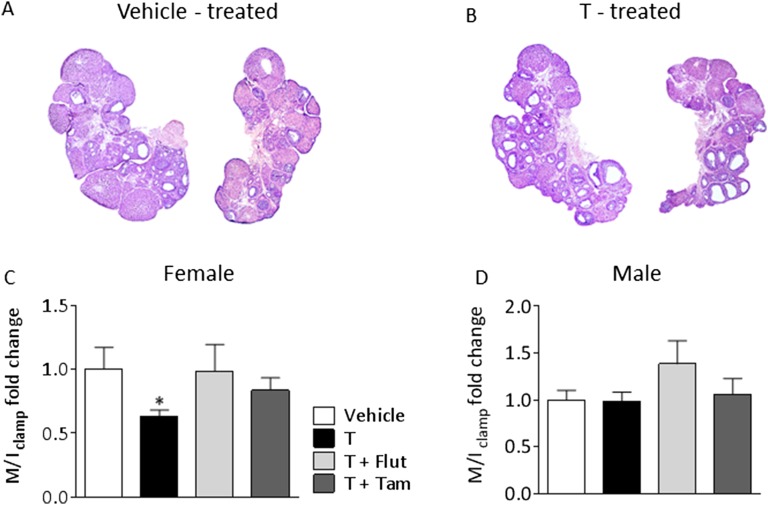
Fig. S2.
Ovarian morphology and insulin sensitivity of offspring. (A) Two representative pictures of ovaries from vehicle-treated and (B) two from T-treated offspring. The 4-μm sections of each ovary were taken 40 μm apart at the largest diameter, mounted on a glass slide, stained with H&E, and analyzed by conventional light microscopy (5× magnification). The insulin sensitivity index (M/I clamp) in (C) female and (D) male offspring of T-treated dams obtained during the euglycemic-hyperinsulinemic clamp. Values represent means ± SEM, *P < 0.05 vs. vehicle analyzed by Student t test. (Graphpad prism 6). Females: vehicle, n = 6; T, n = 9; T+Flut, n = 8; T+Tam, n = 11, and males vehicle, n = 10; T, n = 9; T+Flut, n = 9; T+Tam, n = 9.

