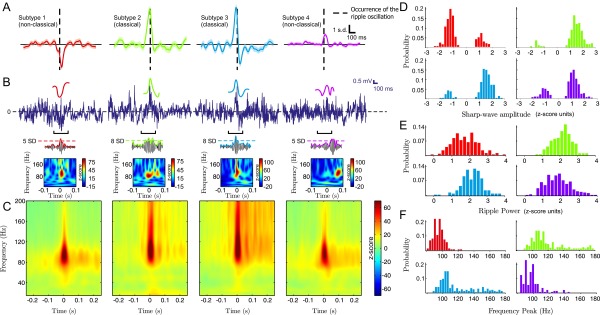
Fig. S6.
Classification of SPW-R complexes across four experimental sessions in unanesthetized macaque monkeys. (A) Grand averages of ripple power-triggered SPW-R field potential signatures, from one representative stratum radiatum recording site. Occurrence of the ripple oscillation is marked by dashed lines. Shaded areas indicate SEM. (B, Top) Representative SPWs and related raw signals of each event type. (B, Middle) Filtered, Z-scored LFP in the ripple frequency range (80–180 Hz). Dashed lines indicate ripple amplitude in SD units. (B, Bottom) Z-scored single-event time–frequency spectrum of the broadband signal presented in the top rows. (C) Spectrogram grand averages, in correspondence with each of the SPW-R signatures depicted in A. Averages are computed across all recording sites. (D–F) SPW and ripple subtypes statistics. (D) SPW amplitude. (E) Ripple power. (F) Ripple frequency peak. Colors denote the distinct SPW-R signatures.

