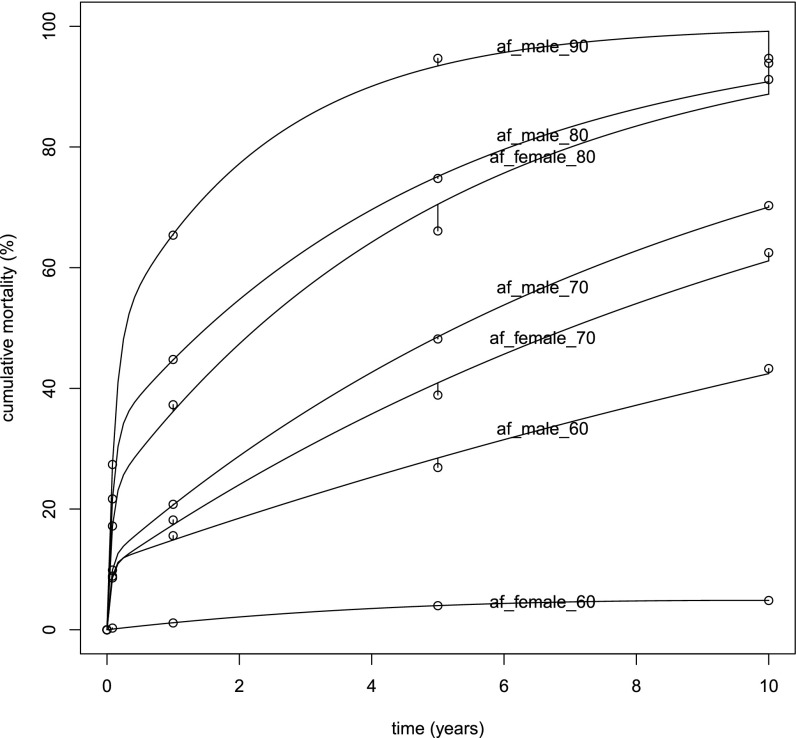
Fig. S1.
Fit of the kinetic model (Eqs. 1 and 2)—the lines, one for each gender and age group—to data from table 2 of ref. 18 (circles). It shows the extent to which a set of biexponential models, with a high-risk and a low-risk component for age and gender subgroup, fits the observed data and thus justifies why we modeled each age and gender group with the two species.

