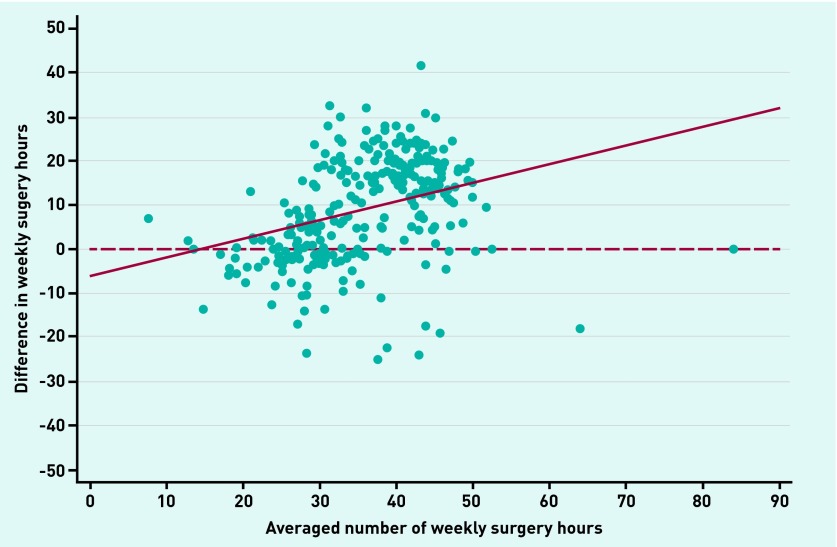
Figure 2.
Relationship between the averaged number of weekly surgery hours recorded in the telephone survey and NHS Choices data, and the difference between the datasets. Number of practices = 268. Difference in weekly surgery hours = number of hours in NHS Choices data – number of hours in telephone survey data. Pearson correlation coefficient, r = 0.34 (95% CI = 0.23 to 0.44). Solid line represents the predictions from a linear regression of the difference in the number of surgery hours on the averaged number of surgery hours. Dashed line represents perfect agreement between data sources.

