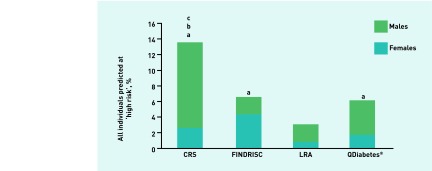
Figure 5.
Proportion of individuals predicted to be at high risk of developing type 2 diabetes: all individuals. aDenotes higher proportion than Leicester Risk Assessment. bDenotes higher proportion than QDiabetes®. cDenotes higher proportion than FINDRISC (P < 0.05). CRS = Cambridge Risk Score. LRA = Leicester Risk Assessment.

