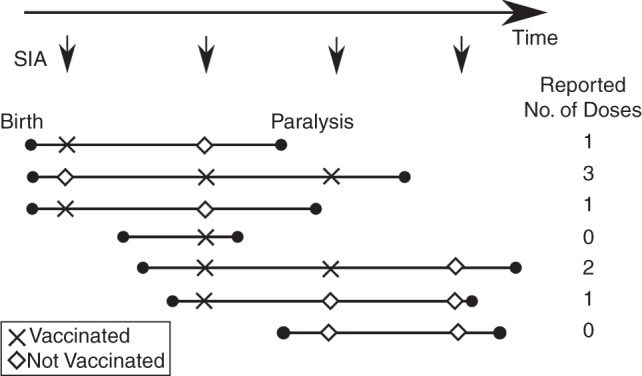
Figure 1.

Schematic diagram of acute flaccid paralysis (AFP) data and the novel method the authors used for estimating oral poliovirus vaccine (OPV) immunization coverage in Pakistan. Lines representing the life histories of 7 children up to the onset of AFP are shown. The arrows at the top of the figure correspond to supplementary immunization activity (SIA), and the X's and diamonds for each child indicate whether the child was vaccinated during each SIA. Differences in the reported numbers of OPV doses received through SIA between children with AFP can be used to infer SIA coverage and is the basis for the new method described in the text (see Methods). In this example, 28.6% of children are reported to have received zero doses of OPV and no children are reported to have received more than 3 doses of OPV. In contrast to the new method, these summary statistics do not account for the age of each child, exposure to different numbers of SIAs, or errors in recall.
