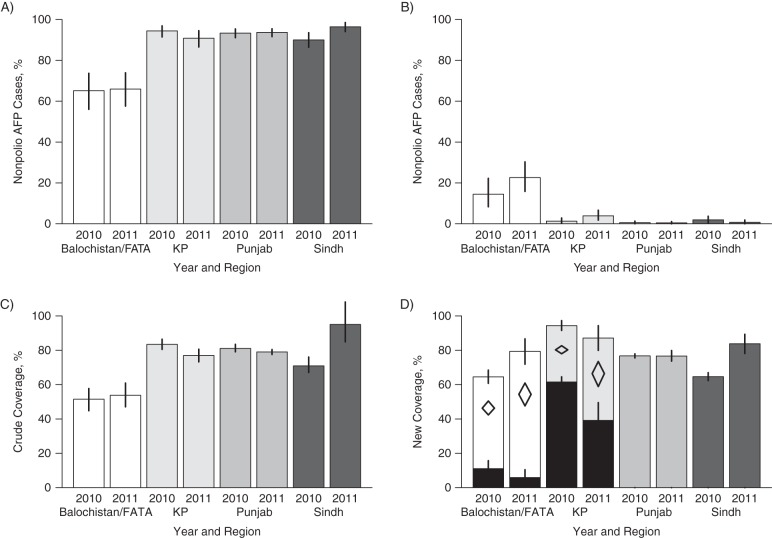
Figure 3.
Summary statistics and estimates of oral poliovirus vaccine (OPV) immunization campaign coverage for specified regions of Pakistan, 2010–2011. The upper panels show the percentages of nonpolio acute flaccid paralysis (AFP) cases among children aged 6–23 months who were reported to have received more than 3 doses of OPV (A) and zero doses of OPV (B). Panel C presents crude estimates of vaccination coverage obtained by dividing the reported number of OPV doses by the number of immunization campaigns experienced by each child. Note that the upper limit can exceed 100%, reflecting error reporting. Panel D presents estimates of vaccination coverage obtained using the new method. In Balochistan/Federally Administered Tribal Areas (FATA) and Khyber Pakhtunkhwa (KP), the heterogeneous model gave the best fit, where 34% and 43% of children, respectively, were estimated to be in the undervaccinated group. Coverage in the undervaccinated group is shown by the black bars. The open diamonds indicate average coverage across the 2 groups in the heterogeneous model. The error bars in panels A–C indicate the 95% confidence intervals, and the error bars in panel D show the 95% credible intervals from the best-fit model.

