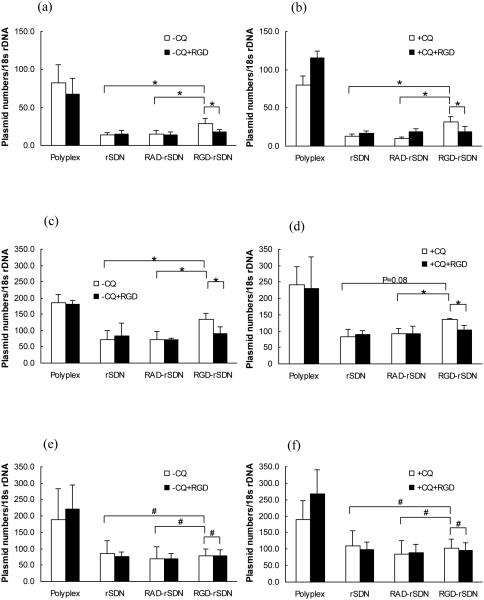
Figure 6.
Normalized cell uptake of rSDN. (a) uptake in B16F10 cells in the absence of chloroquine (−CQ); (b) uptake in B16F10 cells in the presence of 100 µM chloroquine (+CQ); (c) uptake in HUVEC cells in the absence of chloroquine (−CQ); (d) uptake in HUVEC cells in the presence of 100 µM chloroquine (+CQ); (e) uptake in THLE-3 cells in the absence of chloroquine (−CQ); (f) uptake in THLE-3 cells in the presence of 100 µM chloroquine (+CQ). Cell uptake was measured in the presence (black bars) or absence (white bars) of competing free c(RGDyK) by real time PCR. The uptake is expressed as the number of plasmid DNA copies per 18s rDNA. (# p-value > 0.05; * p-value < 0.05, n=4)

