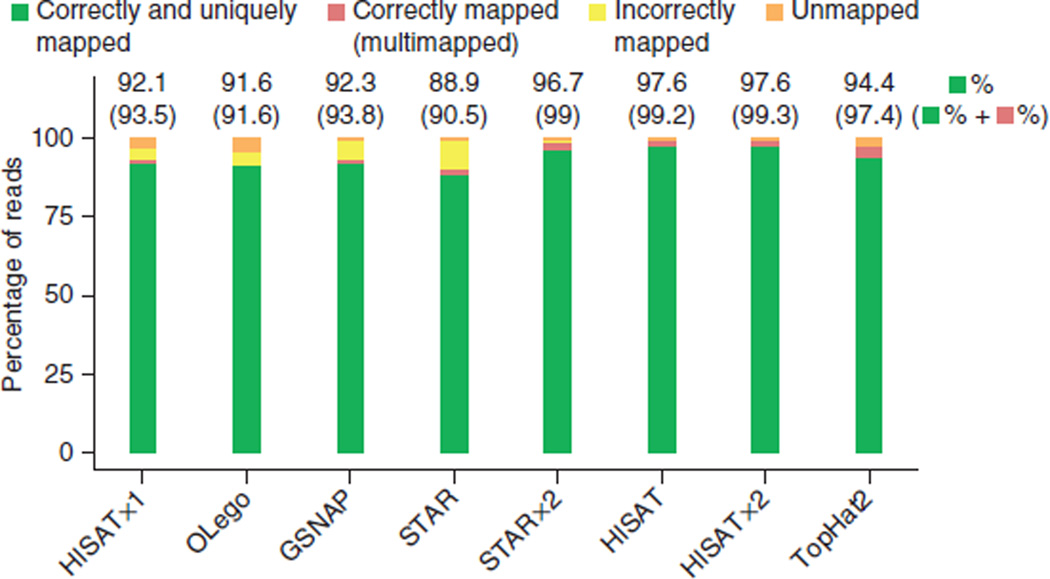
Figure 3.
Alignment accuracy of spliced alignment software for 20 million simulated 100-bp reads. Alignment results for all read types (defined in Fig. 1) on simulated data containing errors. Reads are categorized as indicated by the colors. For multimapped reads, an aligner was credited with a correct alignment if it mapped a read to multiple locations and one of those locations was correct. Note that the set of multimapped reads reported by the various aligners may be different, depending on each program’s alignment policy and default behavior. The upper numbers are the percentages corresponding to correctly and uniquely mapped reads. The numbers inside parentheses show percentages for cases correctly and uniquely mapped and correctly multimapped combined. In Supplementary Table 2, we provide detailed percentages on all four categories for each aligner.

