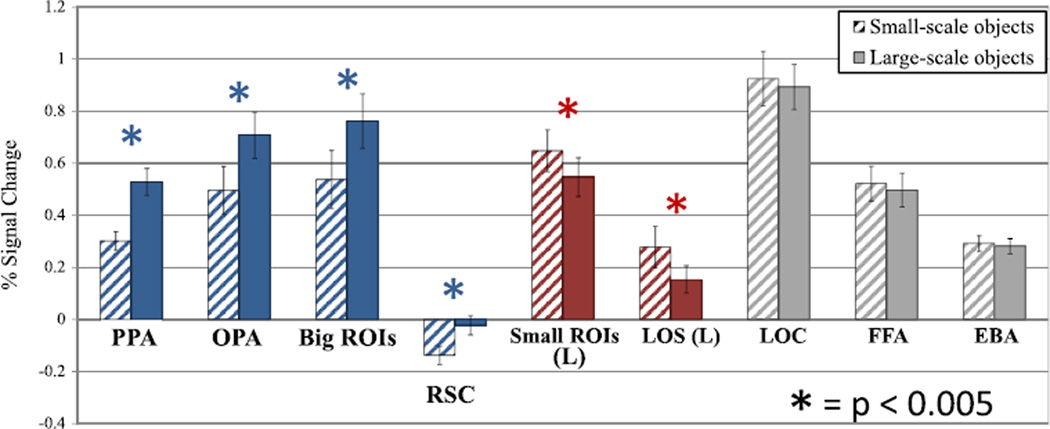
Fig. 2.
ROI analysis of percent signal change for viewing objects of small scale versus large scale. Regions are grouped based on whether they are more selective for larger entities (in blue: PPA, OPA, Big ROIs, RSC), smaller entities (in red: left Small ROIs, left LOS),or neither (LOC, FFA, EBA). Asterisks indicate significant differences in a paired t-test (all p < 0.005), and error bars indicate standard error of the mean.

