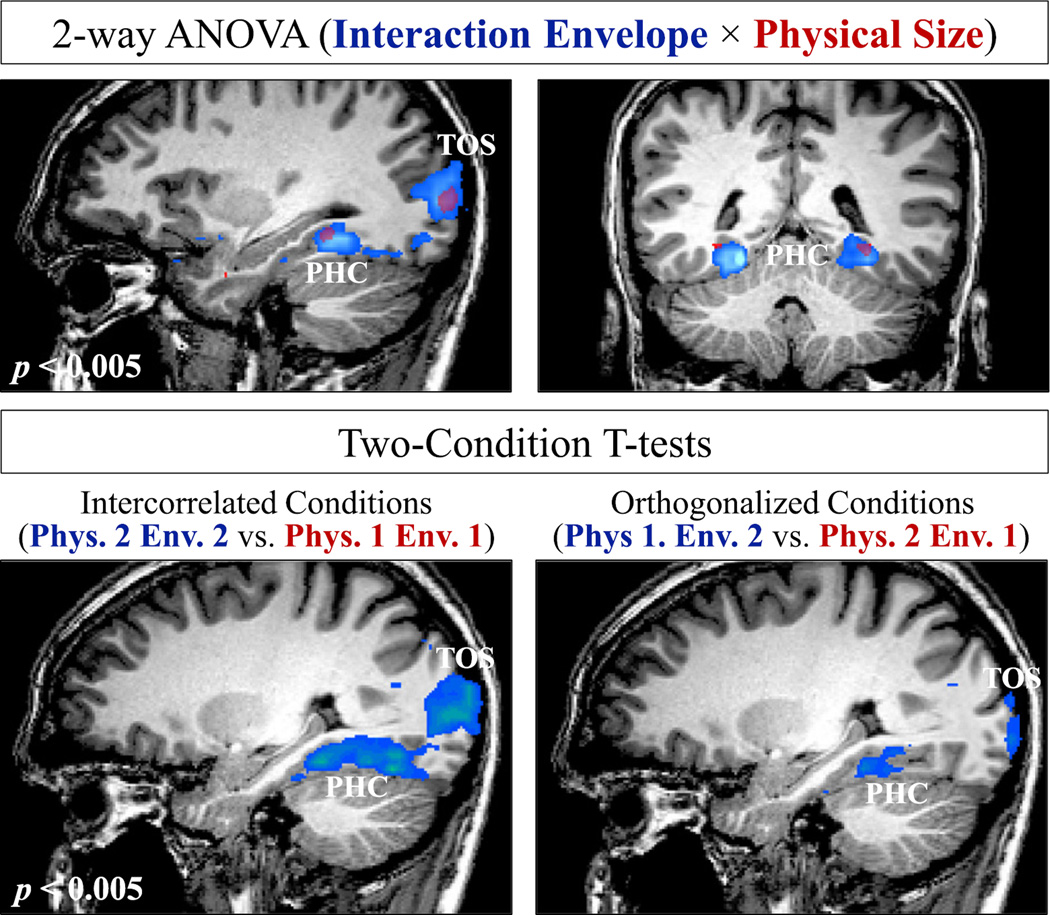
Fig. 4.
A random-effects whole brain analysis (N = 16). (Top) F-maps (a sagittal and coronal view) for a repeated-measures 2-way ANOVA, showing voxels with a significant main effect (p < 0.005 uncorrected) for interaction envelope (blue) and physical size (red). (Bottom) T-maps for general linear models on the conditions. The intercorrelated condition map (left) shows the contrast of significant activation (p < 0.005 uncorrected) for objects of both small physical size and envelope (red—no voxels emerge) versus objects of both large physical size and envelope (blue). The orthogonalized conditions map (right) shows the contrast of significant activation of the other two conditions where size and interaction envelope are not correlated—small physical size and large envelope size (blue) versus large physical size and small envelope size (red—no voxels emerge).

