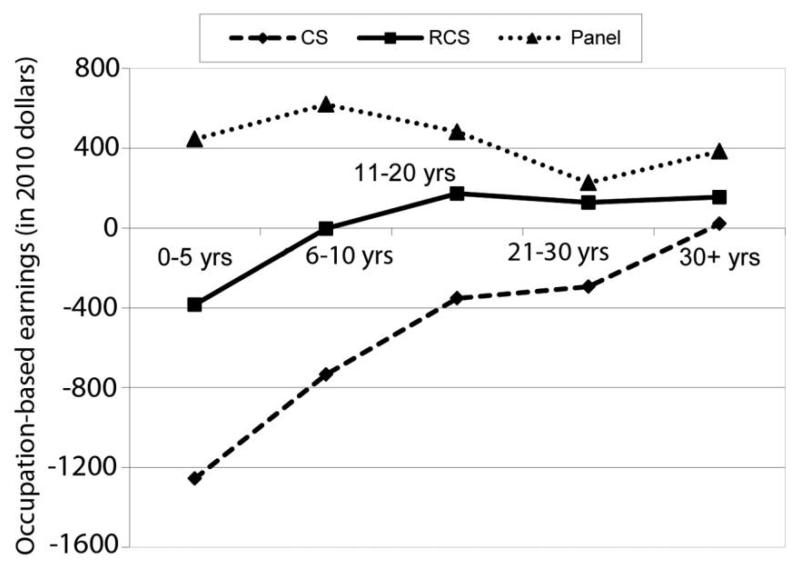
Fig. 2.
—Convergence in occupation score between immigrants and native-born workers by time spent in the United States, cross-sectional and panel data, 1900–1920. The graph plots coefficients for years spent in the United States indicators in equation (1). Note that for the panel line, we subtract the native-born dummy from the years in the United States indicators (because the omitted category in that regression is natives in the panel sample). See table 4 for coefficients and standard errors.

