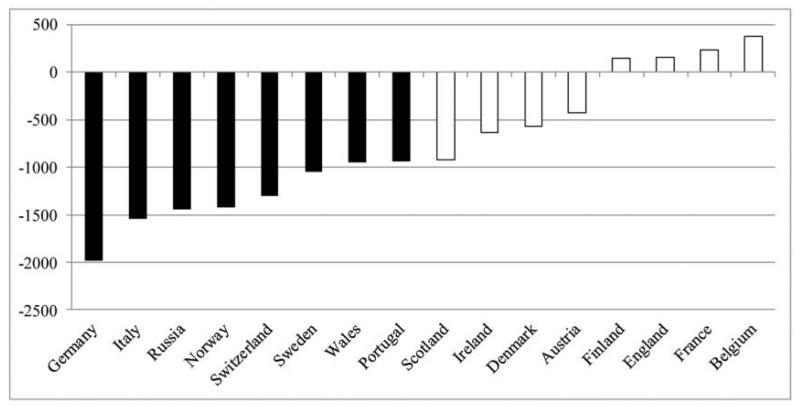
Fig. 4.
—Changing quality of arrival cohorts, difference between immigrant penalty for early and late arrivals in the panel sample, by country of origin. Estimates are based on the version of equation (1) that contains country fixed effects and dummy variables for four arrival cohorts (see table 7, panel B). In addition, we interact the country fixed effects with the dummy variables for arrival cohort. The graph reports the difference between the dummy variable for arriving in the United States between 1880 and 1885 and the dummy variable for arriving in the United States between 1895 and 1900, separately by country. Differences that are significantly different from zero are in black. The sample includes observations in the panel sample.

