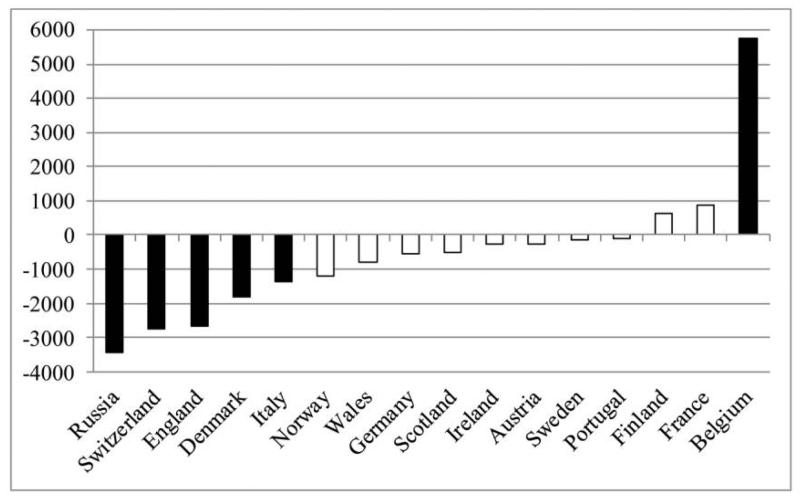
Fig. 5.
—Implied selection of return migrants, difference between estimated convergence in panel and repeated cross-section data, by country of origin. The figure reports the difference between immigrants’ occupational upgrading relative to natives (defined as the difference between occupation-based earnings after 21–30 years and after 0–5 years) in the panel sample versus the cross section, by sending country. Results are from a regression of equation (1) that pools the panel and cross-section samples. Coefficients that are significantly different from zero are in black.

