
FIGURE 3.
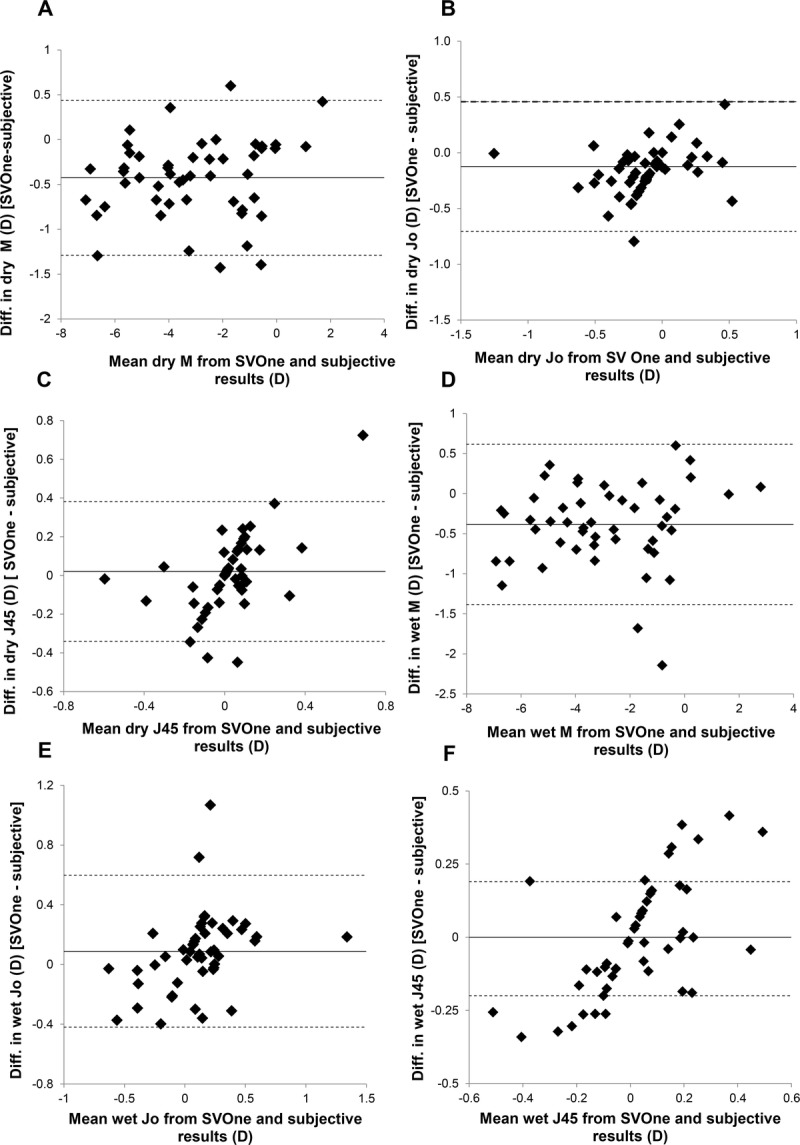
Plots showing the difference between the SVOne and subjective refraction findings, with respect to the mean of these two results for 50 subjects. A to C show the findings for M, J0, and J45, respectively, without cycloplegia. D to F show the findings for M, J0, and J45, respectively, under cycloplegia. In all figures, the solid line represents the mean difference, whereas the upper and lower dashed lines indicate the 95% LOA (calculated as 1.96 times the SD of the differences).