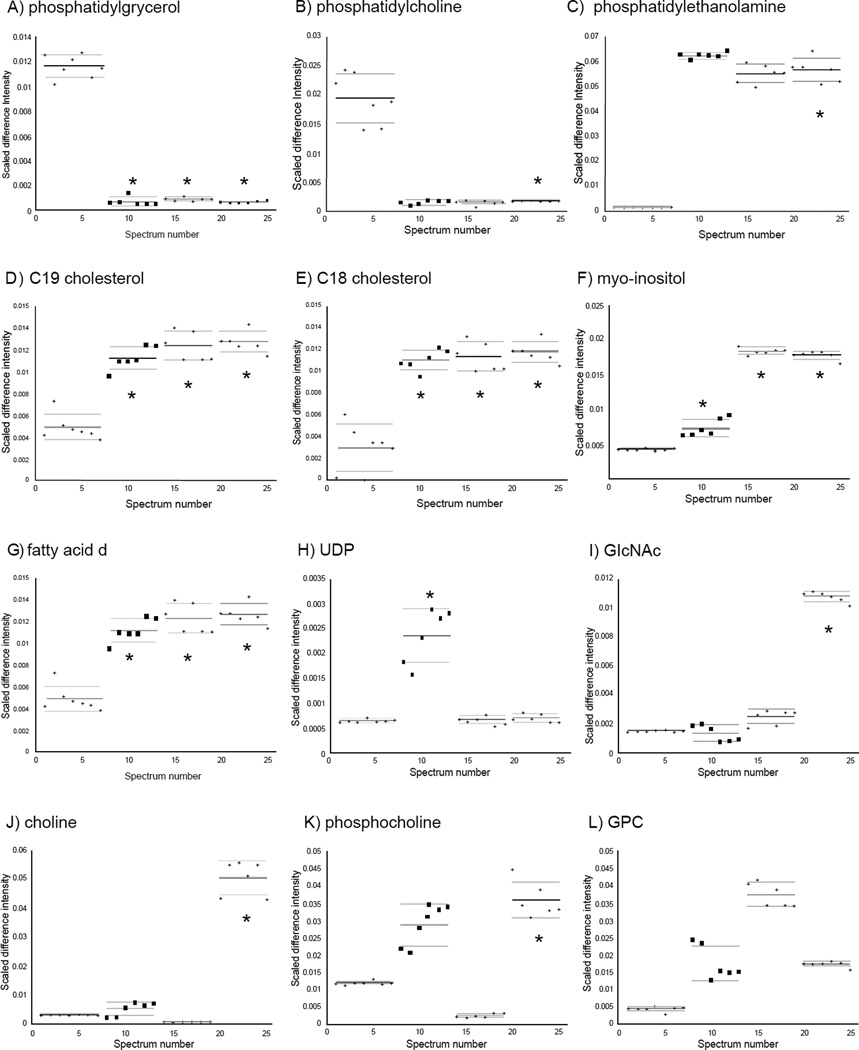
Figure 6.
Plots showing distributions of normalized data points for the 12 metabolites with significant changes involved in cellular membrane composition. From left to right, H6C7, Miapaca-2, Panc-1, and AsPC-1. Solid lines indicate the group means and dashed lines indicate the 95% confidence intervals. (*) indicates p-values for comparison with the control group that are smaller than Bonferroni-corrected a-values (The p-values are listed in Table 2). A) phosphatidylgrycerol, B) phophatidylcholine, C) phosphatidylethanolamine, D) C19 cholesterol, E) C18 cholesterol, F) myo-inositol, G) fatty acid δ, H) UDP, I) GlcNAc, J) choline, K) phosphocholine, L) GPC.

