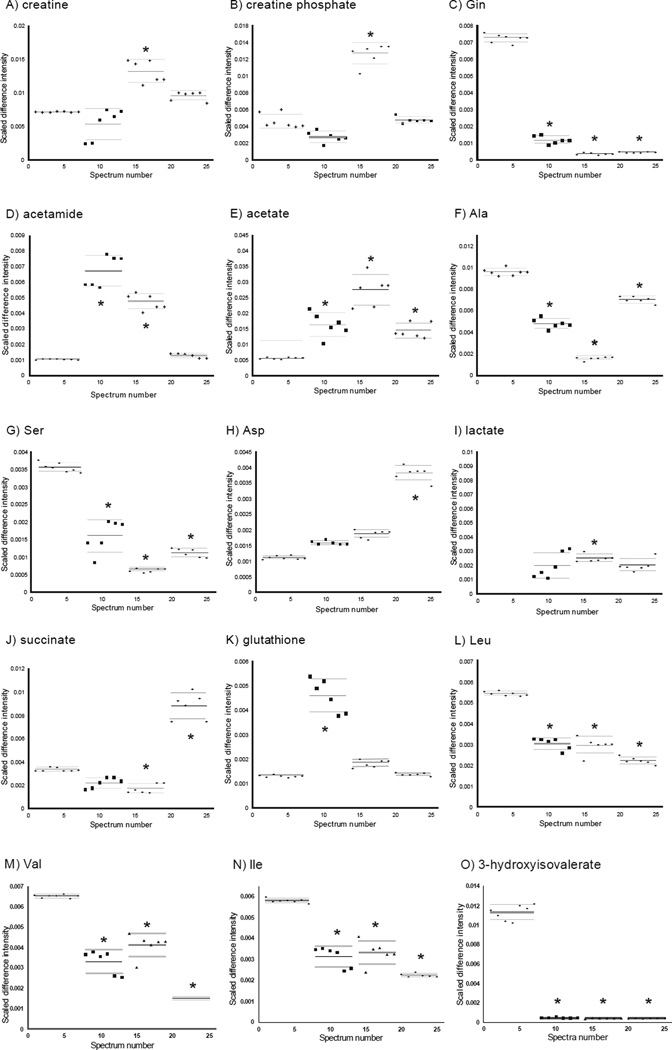
Figure 7.
Plots showing distributions of normalized data points for the 15 metabolites with significant changes involved in creatine pathway, glutamine metabolism and protein synthesis. From left to right, H6C7, Miapaca-2, Panc-1, and AsPC-1. Solid lines indicate the group means and dashed lines indicate the 95% confidence intervals. (*) indicates p-values for comparison with the control group that are smaller than Bonferroni-corrected a-values (The p-values are listed in Table 2). A) creatine, B) creatine phosphate, C) Gln, D) acetamide, E) acetate, F) Ala, G) Ser, H) Asp, I) lactate, J) succinate, K) glutathione, L) Leu, M) Val, N) Ile, O) 3-hydroxyisovalerate.

